
Compare Hind.Construct. with Similar Stocks
Dashboard
Company's ability to service its debt is weak with a poor EBIT to Interest (avg) ratio of 0.87
- Company's ability to service its debt is weak with a poor EBIT to Interest (avg) ratio of 0.87
- The company has been able to generate a Return on Equity (avg) of 1.71% signifying low profitability per unit of shareholders funds
Poor long term growth as Net Sales has grown by an annual rate of -13.60% over the last 5 years
Negative results in Mar 26
With ROCE of 21.1, it has a Attractive valuation with a 2.5 Enterprise value to Capital Employed
79.74% of Promoter Shares are Pledged
Total Returns (Price + Dividend) 
Latest dividend: 0.34447390391844873 per share ex-dividend date: May-30-2011
Risk Adjusted Returns v/s
Returns Beta

News

Hindustan Construction Company Ltd is Rated Hold
Hindustan Construction Company Ltd is rated 'Hold' by MarketsMOJO, with this rating last updated on 06 July 2026. However, the analysis and financial metrics discussed here reflect the stock's current position as of 18 July 2026, providing investors with an up-to-date perspective on the company’s performance and outlook.
Read full news article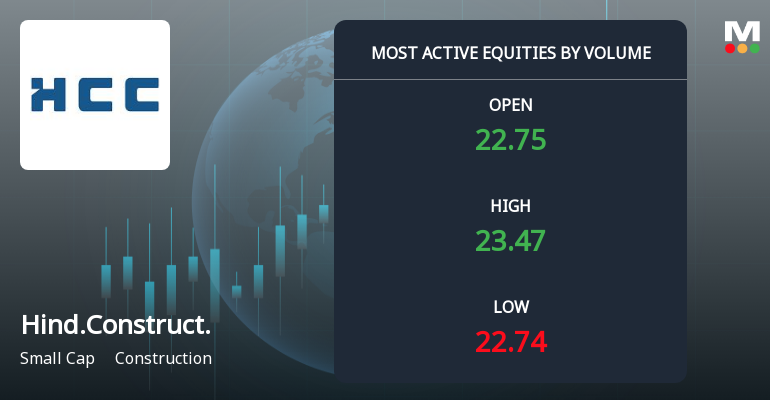
Hindustan Construction Company Ltd Sees Surge in Trading Volume Amid Trend Reversal
Hindustan Construction Company Ltd (HCC) has emerged as one of the most actively traded stocks today, registering a significant surge in volume alongside a modest price recovery after a prolonged decline. The stock’s trading activity and technical signals suggest renewed investor interest, positioning it as a key focus within the construction sector.
Read full news article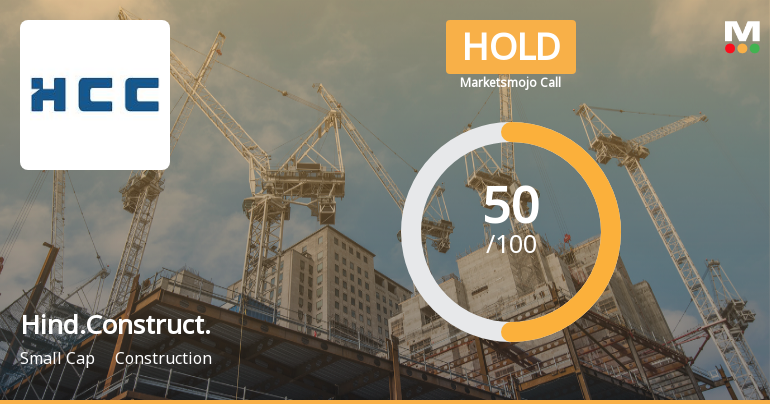
Hindustan Construction Company Ltd Upgraded to Hold on Improved Valuation and Technicals
Hindustan Construction Company Ltd (HCC) has seen its investment rating upgraded from Sell to Hold as of 6 July 2026, reflecting a nuanced improvement across valuation and technical parameters despite ongoing financial challenges. The company’s Mojo Score now stands at 50.0, signalling a more balanced outlook amid mixed signals from quality and financial trends.
Read full news article Announcements
100Th Annual General Meeting Of The Members Of The Company Will Be Held On Tuesday August 18 2026 At 11:00 A.M.
17-Jul-2026 | Source : BSEWe wish to inform you that the 100th Annual General Meeting (AGM) of the Members of the Company will be held on Tuesday August 18 2026 at 11:00 a.m. through Video Conferencing (VC) / Other Audio Visual Means (OAVM) to transact the businesses as set out in the Notice convening the AGM.
Announcement under Regulation 30 (LODR)-Change in Directorate
10-Jul-2026 | Source : BSEIntimation under Regulations 30 and 51 of the SEBI (Listing Obligations and Disclosure Requirements) Regulations 2015
Compliances-Certificate under Reg. 74 (5) of SEBI (DP) Regulations 2018
09-Jul-2026 | Source : BSEPlease find attached Certificate in terms of Regulation 74(5) of SEBI (Depositories and Participants) Regulations 2018
Corporate Actions

No Upcoming Board Meetings

Hindustan Construction Company Ltd has declared 40% dividend, ex-date: 30 May 11

No Splits history available

Hindustan Construction Company Ltd has announced 1:1 bonus issue, ex-date: 10 Aug 10

Hindustan Construction Company Ltd has announced 277:630 rights issue, ex-date: 05 Dec 25
Quality key factors
Valuation key factors
Technicals key factors
 Technical Indicator Scale: Bearish, Mildly Bearish, Sideways, Mildly Bullish, Bullish Turned
 Shareholding Snapshot : Jun 2026
Shareholding Compare (%holding)
Non Institution
82.4324
Held by 6 Schemes (0.24%)
Held by 94 FIIs (11.39%)
Hincon Holdings Ltd (8.26%)
Mukul Mahavir Agrawal (1.91%)
56.25%
Quarterly Results Snapshot (Consolidated) - Mar'26 - YoY

YoY Growth in quarter ended Mar 2026 is -27.77% vs -22.53% in Mar 2025

YoY Growth in quarter ended Mar 2026 is -34.57% vs -63.37% in Mar 2025
Half Yearly Results Snapshot (Consolidated) - Sep'25
Growth in half year ended Sep 2025 is -36.33% vs -14.27% in Sep 2024
Growth in half year ended Sep 2025 is 60.26% vs 23.09% in Sep 2024
Nine Monthly Results Snapshot (Consolidated) - Dec'25
YoY Growth in nine months ended Dec 2025 is -29.61% vs -19.18% in Dec 2024
YoY Growth in nine months ended Dec 2025 is 372.64% vs -90.29% in Dec 2024
Annual Results Snapshot (Consolidated) - Mar'26
YoY Growth in year ended Mar 2026 is -29.16% vs -20.03% in Mar 2025
YoY Growth in year ended Mar 2026 is 46.96% vs -76.45% in Mar 2025
About Hindustan Construction Company Ltd

Company Coordinates


