
Compare Hind.Construct. with Similar Stocks
Dashboard
Company's ability to service its debt is weak with a poor EBIT to Interest (avg) ratio of 0.87
- Company's ability to service its debt is weak with a poor EBIT to Interest (avg) ratio of 0.87
- The company has been able to generate a Return on Equity (avg) of 1.71% signifying low profitability per unit of shareholders funds
Poor long term growth as Net Sales has grown by an annual rate of -13.60% over the last 5 years
Negative results in Mar 26
82.43% of Promoter Shares are Pledged
Total Returns (Price + Dividend) 
Latest dividend: 0.34447390391844873 per share ex-dividend date: May-30-2011
Risk Adjusted Returns v/s
Returns Beta

News
When is the next results date for Hindustan Construction Company Ltd?
The next results date for Hindustan Construction Company Ltd is scheduled for 06 August 2026....
Read full news article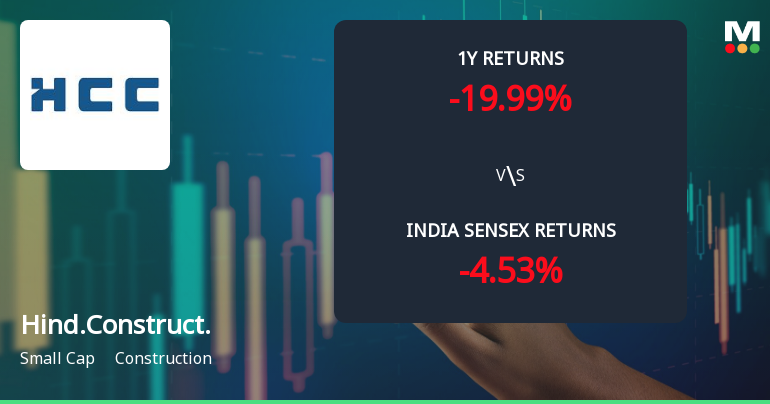
Hindustan Construction Company Ltd Technical Momentum Shifts Amid Mixed Market Signals
Hindustan Construction Company Ltd (HCC) has experienced a subtle shift in its technical momentum, moving from a sideways trend to a mildly bullish stance on daily moving averages, despite mixed signals from key technical indicators such as MACD, RSI, and Bollinger Bands. This nuanced change comes amid a challenging market backdrop and evolving investor sentiment, prompting a reassessment of the stock’s near-term outlook.
Read full news article
Hindustan Construction Company Ltd Downgraded to Sell Amid Weak Financials and Technical Setbacks
Hindustan Construction Company Ltd (HCC) has seen its investment rating downgraded from Hold to Sell as of 28 Jul 2026, reflecting deteriorating technical indicators and disappointing financial performance. The company’s Mojo Score has dropped to 40.0, signalling caution for investors amid weak debt servicing ability, declining sales, and sideways technical trends.
Read full news article Announcements
Hindustan Construction Company Limited - Updates
15-Nov-2019 | Source : NSEHindustan Construction Company Limited has informed the Exchange regarding 'Publication of Unaudited Financial Results of the Company for second quarter ended and half year ended 30th September, 2019'.
Hindustan Construction Company Limited - Analysts/Institutional Investor Meet/Con. Call Updates
14-Nov-2019 | Source : NSEHindustan Construction Company Limited has informed the Exchange regarding Analysts/Institutional Investor Meet/Con. Call Updates
Hindustan Construction Company Limited - Cessation
31-Oct-2019 | Source : NSEHindustan Construction Company Limited has informed the Exchange regarding Cessation of Mr Samuel Joseph as Nominee Director of the company w.e.f. October 30, 2019.
Corporate Actions

06 Aug 2026

Hindustan Construction Company Ltd has declared 40% dividend, ex-date: 30 May 11

No Splits history available

Hindustan Construction Company Ltd has announced 1:1 bonus issue, ex-date: 10 Aug 10

Hindustan Construction Company Ltd has announced 277:630 rights issue, ex-date: 05 Dec 25
Quality key factors
Valuation key factors
Technicals key factors
 Technical Indicator Scale: Bearish, Mildly Bearish, Sideways, Mildly Bullish, Bullish Turned
 Shareholding Snapshot : Jun 2026
Shareholding Compare (%holding)
Non Institution
82.4324
Held by 6 Schemes (0.24%)
Held by 94 FIIs (11.39%)
Hincon Holdings Ltd (8.26%)
Mukul Mahavir Agrawal (1.91%)
56.25%
Quarterly Results Snapshot (Consolidated) - Mar'26 - YoY

YoY Growth in quarter ended Mar 2026 is -27.77% vs -22.53% in Mar 2025

YoY Growth in quarter ended Mar 2026 is -34.57% vs -63.37% in Mar 2025
Half Yearly Results Snapshot (Consolidated) - Sep'25
Growth in half year ended Sep 2025 is -36.33% vs -14.27% in Sep 2024
Growth in half year ended Sep 2025 is 60.26% vs 23.09% in Sep 2024
Nine Monthly Results Snapshot (Consolidated) - Dec'25
YoY Growth in nine months ended Dec 2025 is -29.61% vs -19.18% in Dec 2024
YoY Growth in nine months ended Dec 2025 is 372.64% vs -90.29% in Dec 2024
Annual Results Snapshot (Consolidated) - Mar'26
YoY Growth in year ended Mar 2026 is -29.16% vs -20.03% in Mar 2025
YoY Growth in year ended Mar 2026 is 46.96% vs -76.45% in Mar 2025
About Hindustan Construction Company Ltd

Company Coordinates


