Hind.Tin Works

  • Market Cap: Micro Cap
  • Industry: Packaging
  • ISIN: INE428D01019
  • NSEID:
  • BSEID: 530315
INR
115.30
-3.8 (-3.19%)
BSENSE

Sep 02, 12:06 PM

BSE+NSE Vol: 2.94 k

  • Price Points
  • Score
  • Mojo Parameters
  • Total Return
  • News and Corporate Actions
  • Key factors
  • Shareholding
  • Financials
  • CompanyCV
stock-summaryPrice Point
High/Low

1Day

52 Week

Valuation
Technical
Day's Volume

CASH

2.94 k (-71.71%) Volume

Shareholding (Jun 2026)

FII

0.00%

Held by 0 FIIs

DII

7.94%

Held by 2 DIIs

Promoter

41.11%

Why is Hindustan Tin Works Ltd falling/rising?

02-Sep-2026

As of 01-Sep, Hindustan Tin Works Ltd's stock price is at 119.10, down 0.33%. The stock has underperformed significantly over the past year with a 17.61% decline, driven by weak long-term fundamentals and reduced investor interest.

As of 01-Sep, Hindustan Tin Works Ltd's stock price is currently at 119.10, reflecting a decrease of 0.4 (-0.33%). The stock has underperformed the sector today by 0.51%. Despite a positive performance over the past week with a gain of 0.51%, the stock has shown a significant decline of 17.61% over the past year, indicating a long-term downward trend.<BR><BR>The company's recent financial results have revealed some positive developments, such as the highest operating profit to interest ratio at 3.64 times and a low debt-equity ratio of 0.32 times. However, these positive factors are overshadowed by the weak long-term fundamental strength, evidenced by a -10.05% compound annual growth rate (CAGR) in operating profits over the last five years. Additionally, the stock has generated a return on equity of only 6.99%, suggesting low profitability relative to shareholders' funds.<BR><BR>Investor participation has also declined, with delivery volume falling by 48.06% compared to the five-day average, indicating reduced interest in trading the stock. Furthermore, while the stock is trading at a discount compared to its peers, the overall negative return of -17.61% over the past year, coupled with a decline in profits by 30.2%, contributes to the perception of the stock as a sell.<BR><BR>In summary, the combination of underperformance in the market, declining investor participation, and weak long-term fundamentals are key factors contributing to the falling stock price of Hindustan Tin Works Ltd.

View full answer

Who are in the management team of Hind.Tin Works?

01-Sep-2026

The management team of Hind.Tin Works includes Sanjay Bhatia (Executive Director & Managing Director), Ashok Kumar Bhatia (Chairman), and several independent directors, along with other executives like P P Singh (Executive Director) and Rajat Pathak (Executive Vice President), bringing diverse expertise to the company's governance.

The management team of Hind.Tin Works includes the following individuals:<BR><BR>1. **Sanjay Bhatia** - Executive Director & Managing Director<BR>2. **Ashok Kumar Bhatia** - Chairman / Executive Director<BR>3. **N P Sahni** - Independent Non-Executive Director<BR>4. **Ramesh Kumar Jain** - Independent Non-Executive Director<BR>5. **Aarti Sawhney** - Independent Non-Executive Woman Director<BR>6. **P P Singh** - Executive Director & Wholetime Director<BR>7. **Sanjeev Kumar Abrol** - Independent Director<BR>8. **Vipin Aggarwal** - Independent Director<BR>9. **Susmita Shekhar** - Independent Director<BR>10. **Rajat Pathak** - Executive Vice President<BR><BR>This team brings a diverse range of expertise to the company, contributing to its strategic direction and governance.

View full answer

What does Hind.Tin Works do?

01-Sep-2026

Hindustan Tin Works Ltd is a micro-cap company that manufactures and exports tin cans and packaging components. As of June 2026, it reported net sales of 126 Cr and a net profit of 4 Cr.

Overview:<BR>Hindustan Tin Works Ltd is a leading manufacturer and exporter of tin cans, printed sheets, and related components in the packaging industry, categorized as a micro-cap company.<BR><BR>History:<BR>The company was incorporated in December 1958 as a private limited company and later converted into a public limited company in December 1993. The latest quarterly results reported net sales and net profit for June 2026.<BR><BR>Financial Snapshot:<BR>- Net Sales: 126 Cr (Quarterly Results - Jun 2026)<BR>- Net Profit: 4 Cr (Quarterly Results - Jun 2026)<BR>- Market cap: INR 121 Cr (Micro Cap)<BR><BR>Key Metrics:<BR>- P/E: 13.00<BR>- Industry P/E: 18<BR>- Dividend Yield: 0.68%<BR>- Debt Equity: 0.31<BR>- Return on Equity: 4.19%<BR>- Price to Book: 0.55<BR><BR>Contact Details:<BR>Address: 488 Bartan Market, Sardar Bazar New Delhi Delhi : 110006<BR>Tel: 91-011-23679016/3645<BR>Email: sbhatia@del2.vsnl.net.in<BR>Website: http://www.hindustantin.biz

View full answer

Who are the peers of the Hind.Tin Works?

01-Sep-2026

Peers of Hind.Tin Works include Emmbi Industries, Raaj Medisafe, Kaira Can, AMD Industries, Rollatainers, Shetron, Mega Flex Plast., and Barflex Polyfilm. Hind.Tin Works has an average management risk and a 1-year return of -17.30%, the lowest among its peers, while Raaj Medisafe leads with a 1-year return of 16.65%.

Peers: The peers of Hind.Tin Works are Emmbi Industries, Raaj Medisafe, Kaira Can, AMD Industries, Rollatainers, Shetron, Mega Flex Plast., and Barflex Polyfilm.<BR><BR>Quality Snapshot: Excellent management risk is observed at Raaj Medisafe and Shetron, while Average management risk is found at Emmbi Industries, Kaira Can, Hind.Tin Works, and Barflex Polyfilm, and the rest. Below Average management risk is noted at AMD Industries, Rollatainers, and Mega Flex Plast. Growth is Excellent at Raaj Medisafe, while Good growth is seen at Mega Flex Plast. Average growth is found at Emmbi Industries, Kaira Can, Hind.Tin Works, and the rest, while Below Average growth is observed at AMD Industries, Rollatainers, Shetron, and Barflex Polyfilm. Capital Structure is Excellent at Kaira Can and Barflex Polyfilm, Average at Hind.Tin Works and the rest, and Below Average at Emmbi Industries, AMD Industries, Rollatainers, and Shetron.<BR><BR>Return Snapshot: The peer with the highest 1-year return is Raaj Medisafe at 16.65%, while Hind.Tin Works has a 1-year return of -17.30%, indicating a significantly lower performance compared to Raaj Medisafe. The peer with the lowest 1-year return is Hind.Tin Works at -17.30%. Additionally, Shetron has a negative six-month return of 1.19%.

View full answer

How big is Hind.Tin Works?

01-Sep-2026

As of 31st August, Hindustan Tin Works Ltd has a market capitalization of 121.00 Cr, with recent net sales of 427.20 Cr and a net profit of 9.36 Cr. Shareholder's funds are 215.29 Cr, and total assets amount to 341.21 Cr as of March 2025.

As of 31st August, Hindustan Tin Works Ltd has a market capitalization of 121.00 Cr, classified as a Micro Cap.<BR><BR>In the latest four quarters, the company reported Net Sales of 427.20 Cr and a Net Profit of 9.36 Cr.<BR><BR>The latest annual period for the balance sheet is March 2025, with Shareholder's Funds amounting to 215.29 Cr and Total Assets of 341.21 Cr.

View full answer

Should I buy, sell or hold Hindustan Tin Works Ltd?

15-Aug-2026

Are Hindustan Tin Works Ltd latest results good or bad?

13-Aug-2026

Hindustan Tin Works Ltd's latest results are unfavorable, showing a 58.72% decline in net profit to ₹1.42 crore and a 4.46% drop in net sales to ₹96.45 crore in Q4 FY26, alongside compressed operating margins. Despite slight annual sales growth, net profit fell 30.75%, indicating significant operational challenges.

The latest results for Hindustan Tin Works Ltd indicate a challenging financial situation. In the fourth quarter of FY26, the company reported a net profit of ₹1.42 crore, which represents a significant decline of 58.72% year-on-year. Net sales also fell by 4.46% compared to the same quarter last year, totaling ₹96.45 crore. <BR><BR>Moreover, the operating margin has compressed to 5.52%, down from 7.08% in the same quarter last year, marking the lowest level in recent memory. This decline in profitability is concerning, especially as the company has struggled to maintain its margins amidst rising costs and potentially declining pricing power.<BR><BR>For the full fiscal year, while net sales showed marginal growth of 3.56% to ₹420.47 crore, the net profit fell sharply by 30.75% from the previous year, indicating that the top-line growth did not translate into improved bottom-line performance.<BR><BR>Overall, the results reflect significant operational challenges and a deterioration in profitability, suggesting that the latest financial performance is not favorable for Hindustan Tin Works Ltd. Investors may need to approach this stock with caution given the current trends.

View full answer

When is the next results date for Hindustan Tin Works Ltd?

05-Aug-2026

The next results date for Hindustan Tin Works Ltd is 13 August 2026.

The next results date for Hindustan Tin Works Ltd is scheduled for 13 August 2026.

View full answer

How has been the historical performance of Hind.Tin Works?

13-Nov-2025

Hind.Tin Works has experienced declining net sales and profitability, with net sales dropping to 406.29 Cr in March 2025 from 464.62 Cr in March 2023, while total assets and liabilities increased. Despite improved cash flow from operations, the company faces a challenging liquidity position.

Answer:<BR>The historical performance of Hind.Tin Works shows a fluctuating trend in key financial metrics over the years.<BR><BR>Breakdown:<BR>Hind.Tin Works reported net sales of 406.29 Cr for the year ending March 2025, a decline from 419.35 Cr in March 2024 and 464.62 Cr in March 2023. The total operating income mirrored this trend, decreasing to 406.29 Cr in March 2025 from 419.35 Cr in the previous year. The company's total expenditure, excluding depreciation, also fell to 380.04 Cr in March 2025 from 390.54 Cr in March 2024. Operating profit (PBDIT) decreased to 31.24 Cr in March 2025 from 38.82 Cr in March 2024, while profit before tax dropped to 16.17 Cr from 23.04 Cr during the same period. Consequently, profit after tax was 12.28 Cr in March 2025, down from 17.04 Cr in March 2024. The earnings per share (EPS) also saw a decline, falling to 11.81 in March 2025 from 16.38 in March 2024. On the balance sheet, total assets increased to 341.21 Cr in March 2025 from 316.13 Cr in March 2024, while total liabilities rose to 341.21 Cr from 316.13 Cr. The cash flow from operating activities improved to 55.00 Cr in March 2025 from 18.00 Cr in March 2024, but the net cash outflow was recorded at -1.00 Cr in March 2025, indicating a challenging liquidity position. Overall, the financial performance of Hind.Tin Works reflects a mix of declining profitability and increasing asset and liability levels.

View full answer

Is Hind.Tin Works overvalued or undervalued?

11-Aug-2025

As of August 8, 2025, Hind.Tin Works is considered an attractive investment due to its undervalued status reflected in a PE ratio of 12.39 and a price-to-book value of 0.73, despite recent underperformance against the Sensex, indicating potential for recovery and growth.

As of 8 August 2025, the valuation grade for Hind.Tin Works has moved from very attractive to attractive, indicating a shift in perception regarding its investment potential. The company appears to be undervalued, particularly when considering its price-to-earnings (PE) ratio of 12.39, price-to-book value of 0.73, and an EV to EBITDA ratio of 8.64. These ratios suggest that the company is trading at a discount relative to its earnings and book value.<BR><BR>In comparison to its peers, Hind.Tin Works has a lower PE ratio than Garware Hi Tech, which is at 22, and a more favorable EV to EBITDA ratio compared to Uflex at 12.81. Additionally, the PEG ratio of 0.00 indicates that the company's growth prospects may not be fully reflected in its current valuation. Despite recent underperformance against the Sensex, with a year-to-date return of -25.92% compared to the Sensex's 2.20%, the long-term performance of 251.26% over five years suggests potential for recovery and growth.

View full answer

Who are the top shareholders of the Hind.Tin Works?

17-Jul-2025

The top shareholders of Hind.Tin Works include promoter Sanjay Bhatia with 9.96% and United India Insurance Company Limited with 5.02%. Individual investors hold 44.29% of the shares, and there are no pledged promoter holdings or mutual fund investments.

The top shareholders of Hind.Tin Works include Sanjay Bhatia, who is the promoter with the highest holding at 9.96%. Additionally, United India Insurance Company Limited is the highest public shareholder, holding 5.02%. The majority of the company's shares are held by individual investors, who collectively own 44.29%. There is also one foreign institutional investor (FII) that holds 0.05% of the shares. Notably, there are no pledged promoter holdings and no mutual funds currently invested in the company.

View full answer

What is the technical trend for Hind.Tin Works?

09-Jun-2025

As of May 13, 2025, Hind.Tin Works exhibits a mildly bearish technical trend, with mixed signals from MACD and daily moving averages reinforcing the overall bearish sentiment.

As of 13 May 2025, the technical trend for Hind.Tin Works has changed from bearish to mildly bearish. The weekly MACD indicates a mildly bullish stance, while the monthly MACD is mildly bearish, suggesting mixed signals across time frames. The daily moving averages are mildly bearish, reinforcing the overall bearish sentiment. The Bollinger Bands and KST both show a mildly bearish trend on the weekly and monthly charts. The Dow Theory indicates a mildly bearish stance on the weekly, with no trend on the monthly. The RSI shows no signals on both weekly and monthly time frames. Overall, the technical stance is mildly bearish, driven primarily by the daily moving averages and the Bollinger Bands.

View full answer

Has Hind.Tin Works declared dividend?

06-Jun-2025

Hindustan Tin Works Ltd has declared a 12% dividend, amounting to ₹1.2 per share, with an ex-date of September 20, 2024. While recent returns have been volatile, the company has shown significant growth over longer periods.

Hindustan Tin Works Ltd has declared a 12% dividend.<BR><BR>Dividend Details:<BR>- Percentage announced: 12%<BR>- Amount per share: 1.2<BR>- Ex-date: 20 Sep 24<BR><BR>Dividend Yield: 0.77%.<BR><BR>Total Returns by Period:<BR>In the last 6 months, the price return was -22.43%, with a dividend return of 0%, resulting in a total return of -22.43%.<BR><BR>Over the past year, the price return was -1.43%, with a dividend return of 0.73%, leading to a total return of -0.7%.<BR><BR>In the 2-year period, the price return was 68.59%, the dividend return was 2.47%, which combined for a total return of 71.06%.<BR><BR>For the 3-year period, the price return was 95.51%, with a dividend return of 4.83%, culminating in a total return of 100.34%.<BR><BR>In the last 4 years, the price return was 80.57%, the dividend return was 5.66%, resulting in a total return of 86.23%.<BR><BR>Finally, over the 5-year period, the price return was 307.24%, with a dividend return of 13.09%, leading to a total return of 320.33%.<BR><BR>Overall, Hindustan Tin Works Ltd has declared a dividend, and while recent returns have shown volatility, the longer-term performance indicates significant growth in both price and dividends.

View full answer
iScoreScore
Click here to find our call on this stock
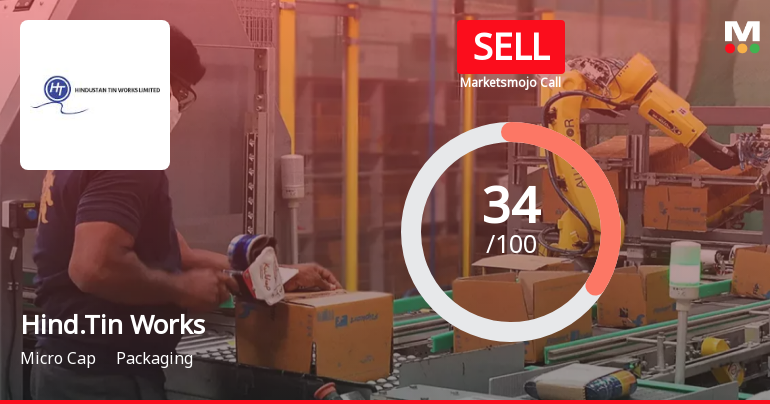
Strong Sell
Sell
Hold
Buy
Strong Buy

Dashboard

1

Weak Long Term Fundamental Strength with a -10.05% CAGR growth in Operating Profits over the last 5 years

  • The company has been able to generate a Return on Equity (avg) of 6.99% signifying low profitability per unit of shareholders funds
2

Underperformed the market in the last 1 year

stock-summaryMojo Parameters

Mojo Parameters

Loading Valuation Snapshot...

Stock DNA

stock-summary
Industry

Packaging

stock-summary
Market cap

INR 120 Cr (Micro Cap)

stock-summary
P/E

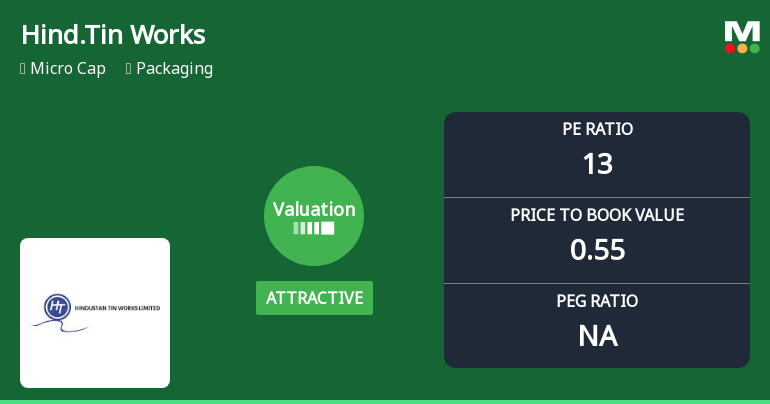
13.00

stock-summary
Industry P/E

18

stock-summary
Dividend Yield

0.67%

stock-summary
Debt Equity

0.31

stock-summary
Return on Equity

4.19%

stock-summary
Price to Book

0.55

Revenue and Profits:
Net Sales:
126 Cr
(Quarterly Results - Jun 2026)
Net Profit:
4 Cr
stock-summaryTotal Returns
Total Returns (Price + Dividend) stock-summary
Dividend Yield (0.67%)
TimePeriod
Price Return
Dividend Return
Total Return
3 Months
8.82%
0.66%
9.48%
6 Months
-0.47%
0.63%
0.16%
1 Year
-20.56%
1.04%
-19.52%
2 Years
-48.69%
1.23%
-47.46%
3 Years
-3.8%
3.26%
-0.54%
4 Years
18.26%
3.93%
22.19%
5 Years
-9.75%
4.16%
-5.59%

Latest dividend: 0.8 per share ex-dividend date: Sep-19-2025

Risk Adjusted Returns v/s stock-summary
Returns Beta
Icon
Beta has not been calculated since enough price history is not available
stock-summaryNews & Corporate Actions

Announcements stock-summary

Corporate Action- Fixes Record Date For Declaration Of Dividend

17-Aug-2026 | Source : BSE

Pursuant to Regulation 42 of the SEBI (LODR) 2015 Notice of Record Date for Declaration of Dividend.

Announcement under Regulation 30 (LODR)-Newspaper Publication

14-Aug-2026 | Source : BSE

Pursuant to Regulation 47 of the SEBI (LODR) 2015 Published unaudited financial results for the quarter ended June 30 2026

Board Meeting Outcome for Outcome Of Board Meeting

13-Aug-2026 | Source : BSE

Outcome of Board Meeting held on 13th August 2026 as per Regulation 30 of SEBI (LODR) 2015

Corporate Actions stock-summary

stock-summary
BOARD MEETING

No Upcoming Board Meetings

stock-summary
DIVIDEND

Hindustan Tin Works Ltd has declared 7% dividend, ex-date: 22 Sep 26

stock-summary
SPLITS

No Splits history available

stock-summary
BONUS

No Bonus history available

stock-summary
RIGHTS

No Rights history available

stock-summaryKey Factors

Quality key factors stock-summary

Factor
Value
Sales Growth (5y)
2.47%
EBIT Growth (5y)
-10.05%
EBIT to Interest (avg)
2.58
Debt to EBITDA (avg)
2.73
Net Debt to Equity (avg)
0.31
Sales to Capital Employed (avg)
1.51
Tax Ratio
24.17%
Dividend Payout Ratio
6.78%
Pledged Shares
0
Institutional Holding
7.94%
ROCE (avg)
7.57%
ROE (avg)
6.99%

Valuation key factors

Factor
Value
P/E Ratio
13
Industry P/E
18
Price to Book Value
0.55
EV to EBIT
10.83
EV to EBITDA
6.70
EV to Capital Employed
0.66
EV to Sales
0.45
PEG Ratio
NA
Dividend Yield
0.67%
ROCE (Latest)
5.72%
ROE (Latest)
4.19%

Technicals key factors

Indicator
Weekly
Monthly
MACD
Mildly Bullish
Bearish
RSI
No Signal
No Signal
Bollinger Bands
Bullish
Bearish
Moving Averages
Mildly Bearish (Daily)
KST
Mildly Bullish
Bearish
Dow Theory
No Trend
No Trend
stock-summary Technical Indicator Scale: Bearish, Mildly Bearish, Sideways, Mildly Bullish, Bullish  Turned 
stock-summaryShareholding
Shareholding Snapshot : Jun 2026stock-summary
Shareholding Compare (%holding) stock-summary
Majority shareholders

Non Institution

Pledged Promoter Holdings

None

Mutual Funds

Held by 0 Schemes

FIIs

Held by 0 FIIs

Promoter with highest holding

Sanjay Bhatia (9.16%)

Highest Public shareholder

United India Insurance Company Limited (5.02%)

Individual Investors Holdings

44.75%

stock-summaryFinancial
[
  {
    "link": "quarterly",
    "btn_text": "All Quarterly Results",
    "header": "Quarterly Results Snapshot (Standalone) - Jun'26 - YoY",
    "rhs": [
      {
        "prefix": "Net Sales ",
        "suffix": "YoY Growth in quarter ended Jun 2026 is 5.64% vs 11.68% in Jun 2025",
        "dir": -1
      },
      {
        "prefix": "Standalone Net Profit ",
        "suffix": "YoY Growth in quarter ended Jun 2026 is 38.04% vs 68.29% in Jun 2025",
        "dir": -1
      }
    ],
    "table": {
      "header": [
        "Jun'26",
        "Jun'25",
        "Change(%)"
      ],
      "body": [
        {
          "field": "Net Sales",
          "val1": "126.10",
          "val2": "119.37",
          "chgp": "5.64%",
          "chgp_class": "positive"
        },
        {
          "field": "Operating Profit (PBDIT) excl Other Income",
          "val1": "9.20",
          "val2": "7.48",
          "chgp": "22.99%",
          "chgp_class": "positive"
        },
        {
          "field": "Interest",
          "val1": "2.53",
          "val2": "2.10",
          "chgp": "20.48%",
          "chgp_class": "negative"
        },
        {
          "field": "Exceptional Items",
          "val1": "0.00",
          "val2": "0.00",
          "chgp": "",
          "chgp_class": "neutral"
        },
        {
          "field": "Standalone Net Profit",
          "val1": "3.81",
          "val2": "2.76",
          "chgp": "38.04%",
          "chgp_class": "positive"
        },
        {
          "field": "Operating Profit Margin (Excl OI)",
          "val1": "7.30%",
          "val2": "6.27%",
          "chgp": "1.03%",
          "chgp_class": "positive"
        }
      ]
    }
  },
  {
    "link": "half-yearly",
    "btn_text": "All Half Yearly Results",
    "header": "Half Yearly Results Snapshot (Standalone) - Sep'25",
    "rhs": [
      {
        "prefix": "Net Sales ",
        "suffix": " Growth in half year ended Sep 2025 is 9.11% vs -7.27% in Sep 2024",
        "dir": 1
      },
      {
        "prefix": "Standalone Net Profit ",
        "suffix": " Growth in half year ended Sep 2025 is -22.18% vs -33.60% in Sep 2024",
        "dir": 1
      }
    ],
    "table": {
      "header": [
        "Sep'25",
        "Sep'24",
        "Change(%)"
      ],
      "body": [
        {
          "field": "Net Sales",
          "val1": "236.29",
          "val2": "216.57",
          "chgp": "9.11%",
          "chgp_class": "positive"
        },
        {
          "field": "Operating Profit (PBDIT) excl Other Income",
          "val1": "14.32",
          "val2": "13.06",
          "chgp": "9.65%",
          "chgp_class": "positive"
        },
        {
          "field": "Interest",
          "val1": "4.94",
          "val2": "3.64",
          "chgp": "35.71%",
          "chgp_class": "negative"
        },
        {
          "field": "Exceptional Items",
          "val1": "0.00",
          "val2": "0.00",
          "chgp": "",
          "chgp_class": "neutral"
        },
        {
          "field": "Standalone Net Profit",
          "val1": "4.49",
          "val2": "5.77",
          "chgp": "-22.18%",
          "chgp_class": "negative"
        },
        {
          "field": "Operating Profit Margin (Excl OI)",
          "val1": "6.06%",
          "val2": "6.03%",
          "chgp": "0.03%",
          "chgp_class": "positive"
        }
      ]
    }
  },
  {
    "link": "nine-monthly",
    "btn_text": "All Nine Monthly Results",
    "header": "Nine Monthly Results Snapshot (Standalone) - Dec'25",
    "rhs": [
      {
        "prefix": "Net Sales ",
        "suffix": "YoY Growth in nine months ended Dec 2025 is 6.12% vs -7.92% in Dec 2024",
        "dir": 1
      },
      {
        "prefix": "Standalone Net Profit ",
        "suffix": "YoY Growth in nine months ended Dec 2025 is -22.06% vs -36.90% in Dec 2024",
        "dir": 1
      }
    ],
    "table": {
      "header": [
        "Dec'25",
        "Dec'24",
        "Change(%)"
      ],
      "body": [
        {
          "field": "Net Sales",
          "val1": "324.02",
          "val2": "305.33",
          "chgp": "6.12%",
          "chgp_class": "positive"
        },
        {
          "field": "Operating Profit (PBDIT) excl Other Income",
          "val1": "21.73",
          "val2": "19.09",
          "chgp": "13.83%",
          "chgp_class": "positive"
        },
        {
          "field": "Interest",
          "val1": "7.42",
          "val2": "5.05",
          "chgp": "46.93%",
          "chgp_class": "negative"
        },
        {
          "field": "Exceptional Items",
          "val1": "0.00",
          "val2": "0.00",
          "chgp": "",
          "chgp_class": "neutral"
        },
        {
          "field": "Standalone Net Profit",
          "val1": "6.89",
          "val2": "8.84",
          "chgp": "-22.06%",
          "chgp_class": "negative"
        },
        {
          "field": "Operating Profit Margin (Excl OI)",
          "val1": "6.71%",
          "val2": "6.25%",
          "chgp": "0.46%",
          "chgp_class": "positive"
        }
      ]
    }
  },
  {
    "link": "annual",
    "btn_text": "All Annual Results",
    "header": "Annual Results Snapshot (Standalone) - Mar'26",
    "rhs": [
      {
        "prefix": "Net Sales ",
        "suffix": "YoY Growth in year ended Mar 2026 is 3.49% vs -3.11% in Mar 2025",
        "dir": 1
      },
      {
        "prefix": "Standalone Net Profit ",
        "suffix": "YoY Growth in year ended Mar 2026 is -32.33% vs -27.93% in Mar 2025",
        "dir": -1
      }
    ],
    "table": {
      "header": [
        "Mar'26",
        "Mar'25",
        "Change(%)"
      ],
      "body": [
        {
          "field": "Net Sales",
          "val1": "420.48",
          "val2": "406.29",
          "chgp": "3.49%",
          "chgp_class": "positive"
        },
        {
          "field": "Operating Profit (PBDIT) excl Other Income",
          "val1": "27.06",
          "val2": "26.25",
          "chgp": "3.09%",
          "chgp_class": "positive"
        },
        {
          "field": "Interest",
          "val1": "9.82",
          "val2": "6.75",
          "chgp": "45.48%",
          "chgp_class": "negative"
        },
        {
          "field": "Exceptional Items",
          "val1": "0.00",
          "val2": "0.00",
          "chgp": "",
          "chgp_class": "neutral"
        },
        {
          "field": "Standalone Net Profit",
          "val1": "8.31",
          "val2": "12.28",
          "chgp": "-32.33%",
          "chgp_class": "negative"
        },
        {
          "field": "Operating Profit Margin (Excl OI)",
          "val1": "6.44%",
          "val2": "6.46%",
          "chgp": "-0.02%",
          "chgp_class": "negative"
        }
      ]
    }
  }
]

Quarterly Results Snapshot (Standalone) - Jun'26 - YoYstock-summary

Jun'26
Jun'25
Change(%)
Net Sales
126.10
119.37
5.64%
Operating Profit (PBDIT) excl Other Income
9.20
7.48
22.99%
Interest
2.53
2.10
20.48%
Exceptional Items
0.00
0.00
Standalone Net Profit
3.81
2.76
38.04%
Operating Profit Margin (Excl OI)
7.30%
6.27%
1.03%
Values in Rs Cr.
Direction Arrows
Net Sales

YoY Growth in quarter ended Jun 2026 is 5.64% vs 11.68% in Jun 2025

Direction Arrows
Standalone Net Profit

YoY Growth in quarter ended Jun 2026 is 38.04% vs 68.29% in Jun 2025

Half Yearly Results Snapshot (Standalone) - Sep'25stock-summary

Sep'25
Sep'24
Change(%)
Net Sales
236.29
216.57
9.11%
Operating Profit (PBDIT) excl Other Income
14.32
13.06
9.65%
Interest
4.94
3.64
35.71%
Exceptional Items
0.00
0.00
Standalone Net Profit
4.49
5.77
-22.18%
Operating Profit Margin (Excl OI)
6.06%
6.03%
0.03%
Values in Rs Cr.
Direction Arrows
Net Sales

Growth in half year ended Sep 2025 is 9.11% vs -7.27% in Sep 2024

Direction Arrows
Standalone Net Profit

Growth in half year ended Sep 2025 is -22.18% vs -33.60% in Sep 2024

Nine Monthly Results Snapshot (Standalone) - Dec'25stock-summary

Dec'25
Dec'24
Change(%)
Net Sales
324.02
305.33
6.12%
Operating Profit (PBDIT) excl Other Income
21.73
19.09
13.83%
Interest
7.42
5.05
46.93%
Exceptional Items
0.00
0.00
Standalone Net Profit
6.89
8.84
-22.06%
Operating Profit Margin (Excl OI)
6.71%
6.25%
0.46%
Values in Rs Cr.
Direction Arrows
Net Sales

YoY Growth in nine months ended Dec 2025 is 6.12% vs -7.92% in Dec 2024

Direction Arrows
Standalone Net Profit

YoY Growth in nine months ended Dec 2025 is -22.06% vs -36.90% in Dec 2024

Annual Results Snapshot (Standalone) - Mar'26stock-summary

Mar'26
Mar'25
Change(%)
Net Sales
420.48
406.29
3.49%
Operating Profit (PBDIT) excl Other Income
27.06
26.25
3.09%
Interest
9.82
6.75
45.48%
Exceptional Items
0.00
0.00
Standalone Net Profit
8.31
12.28
-32.33%
Operating Profit Margin (Excl OI)
6.44%
6.46%
-0.02%
Values in Rs Cr.
Direction Arrows
Net Sales

YoY Growth in year ended Mar 2026 is 3.49% vs -3.11% in Mar 2025

Direction Arrows
Standalone Net Profit

YoY Growth in year ended Mar 2026 is -32.33% vs -27.93% in Mar 2025

stock-summaryCompany CV
About Hindustan Tin Works Ltd stock-summary
stock-summary
Hindustan Tin Works Ltd
Micro Cap
Packaging
Hindustan Tin Works Limited was incorporated in December, 1958 as a private limited company to trade in and manufacture tin metal containers and tin sheets. The company was converted into a public limited company in December, 1993. The Company is one of the leading manufacturer and exporter of tin cans, printed sheets, and related components to consumer marketing companies in India and abroad. It is one of the leading and established Company in Metal Packaging Industry.
Company Coordinates stock-summary
Company Details
488 Bartan Market, Sardar Bazar New Delhi Delhi : 110006
stock-summary
Tel: 91-011-23679016/3645
stock-summary
sbhatia@del2.vsnl.net.in
Registrar Details
Beetal Financial & Computer Services (P) Ltd , Beetal House , 99 Mandangir, 3rd Floor, Behind Local Shopping Centre, Near Dada Harsukhdas Mandir, New Delhi