
Compare Hindustan Foods with Similar Stocks
Dashboard
Healthy long term growth as Operating profit has grown by an annual rate 31.35%
The company has declared Positive results for the last 6 consecutive quarters
With ROCE of 12.3, it has a Fair valuation with a 3.6 Enterprise value to Capital Employed
High Institutional Holdings at 20.87%
Total Returns (Price + Dividend) 
Hindustan Foods for the last several years.
Risk Adjusted Returns v/s
Returns Beta

News
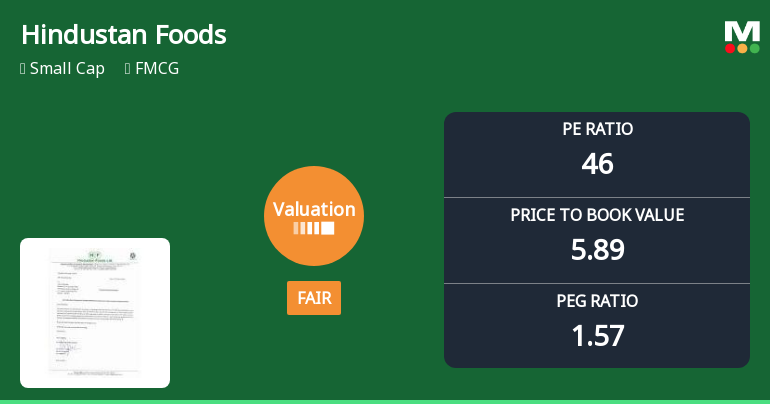
Hindustan Foods Ltd Valuation Shifts to Fair Amidst Strong Market Performance
Hindustan Foods Ltd, a small-cap player in the FMCG sector, has seen a notable shift in its valuation parameters, moving from an attractive to a fair rating. This change reflects evolving market perceptions amid rising price-to-earnings and price-to-book multiples, positioning the stock differently against its peers and historical benchmarks.
Read full news article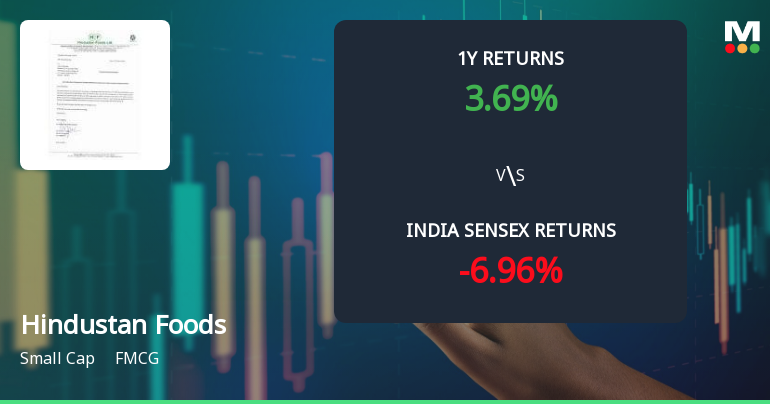
Hindustan Foods Ltd Technical Momentum Shifts Signal Bullish Outlook
Hindustan Foods Ltd has witnessed a notable shift in its technical momentum, with key indicators signalling an increasingly bullish outlook. The company’s recent upgrade from a Hold to a Buy rating, coupled with positive price action and improving moving averages, suggests growing investor confidence in this FMCG small-cap stock amid a mixed macroeconomic backdrop.
Read full news article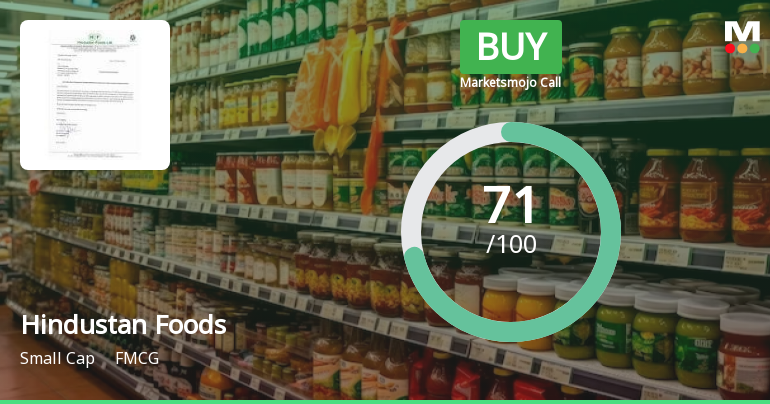
Hindustan Foods Ltd is Rated Buy
Hindustan Foods Ltd is rated 'Buy' by MarketsMOJO, with this rating last updated on 11 June 2026. However, the analysis and financial metrics discussed here reflect the stock's current position as of 23 June 2026, providing investors with the most up-to-date insight into the company’s performance and outlook.
Read full news article Announcements
Announcement under Regulation 30 (LODR)-Analyst / Investor Meet - Intimation
18-Jun-2026 | Source : BSEWe would like to inform you that the officials of the Company will be attending the Investor Conference . Discussions will be based on publicly available information. No unpublished price sensitive information (UPSI) is intended to be discussed during the interactions. This information is submitted to you pursuant to Regulation 30(6) of the Securities and Exchange Board of India (Listing Obligations and Disclosure Requirements) Regulations 2015. Kindly note that changes may happen due to exigencies on the part of Host / Company.
Announcement under Regulation 30 (LODR)-Analyst / Investor Meet - Intimation
03-Jun-2026 | Source : BSEPursuant to the relevant provisions of SEBI (Listing Obligations and Disclosure Requirements) Regulations 2015 we would like to inform you that the officials of the Company will be attending the Investor Conference as per attached PDF file.
Announcement Under Regulation 30 (LODR) - Updates (Intimation Of Order Received Under CGST/ SGST Act 2017)
29-May-2026 | Source : BSEPlease refer to the attached PDF file.
Corporate Actions

No Upcoming Board Meetings

No Dividend history available

Hindustan Foods Ltd has announced 2:10 stock split, ex-date: 21 Jul 22

No Bonus history available

No Rights history available
Quality key factors
Valuation key factors
Technicals key factors
 Technical Indicator Scale: Bearish, Mildly Bearish, Sideways, Mildly Bullish, Bullish Turned
 Shareholding Snapshot : Mar 2026
Shareholding Compare (%holding)
Promoters
None
Held by 4 Schemes (1.68%)
Held by 72 FIIs (5.82%)
Vanity Case India Private Limited (38.88%)
Icici Prudential Life Insurance Company Limited (5.04%)
11.83%
Quarterly Results Snapshot (Consolidated) - Mar'26 - QoQ

QoQ Growth in quarter ended Mar 2026 is 6.99% vs 0.50% in Dec 2025

QoQ Growth in quarter ended Mar 2026 is 7.20% vs 10.02% in Dec 2025
Half Yearly Results Snapshot (Consolidated) - Sep'25
Growth in half year ended Sep 2025 is 16.10% vs 35.28% in Sep 2024
Growth in half year ended Sep 2025 is 33.44% vs 4.45% in Sep 2024
Nine Monthly Results Snapshot (Consolidated) - Dec'25
YoY Growth in nine months ended Dec 2025 is 16.95% vs 30.01% in Dec 2024
YoY Growth in nine months ended Dec 2025 is 34.03% vs 12.56% in Dec 2024
Annual Results Snapshot (Consolidated) - Mar'26
YoY Growth in year ended Mar 2026 is 16.83% vs 32.09% in Mar 2025
YoY Growth in year ended Mar 2026 is 29.30% vs 23.91% in Mar 2025
About Hindustan Foods Ltd

Company Coordinates


