
Compare Hindustan Hardy with Similar Stocks
Stock DNA
Auto Components & Equipments
INR 130 Cr (Micro Cap)
15.00
37
0.32%
0.13
24.60%
3.80
Total Returns (Price + Dividend) 
Latest dividend: 2.8 per share ex-dividend date: Sep-09-2025
Risk Adjusted Returns v/s
Returns Beta

News
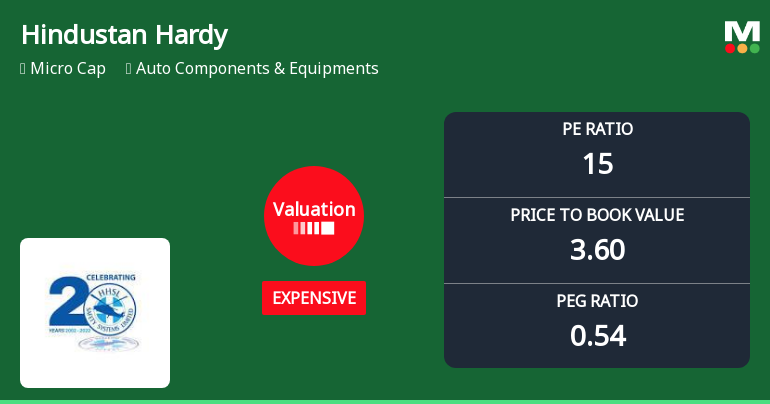
Hindustan Hardy Ltd Valuation Shifts Signal Growing Price Pressure Amid Sector Dynamics
Hindustan Hardy Ltd, a micro-cap player in the Auto Components & Equipments sector, has seen its valuation metrics shift notably, prompting a downgrade in its Mojo Grade from Hold to Sell as of 8 Dec 2025. The company’s price-to-earnings (P/E) and price-to-book value (P/BV) ratios have moved from fair to expensive territory, raising questions about its price attractiveness relative to historical levels and peer benchmarks.
Read full news article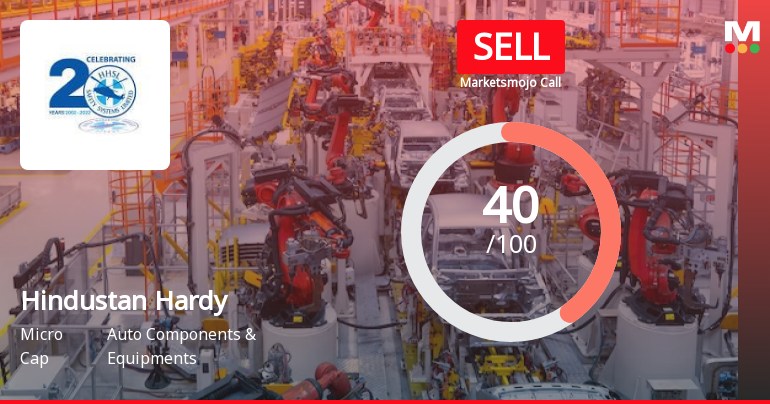
Hindustan Hardy Ltd is Rated Sell
Hindustan Hardy Ltd is rated Sell by MarketsMOJO, with this rating last updated on 08 Dec 2025. However, the analysis and financial metrics discussed here reflect the stock’s current position as of 16 June 2026, providing investors with an up-to-date view of the company’s fundamentals, returns, and market performance.
Read full news article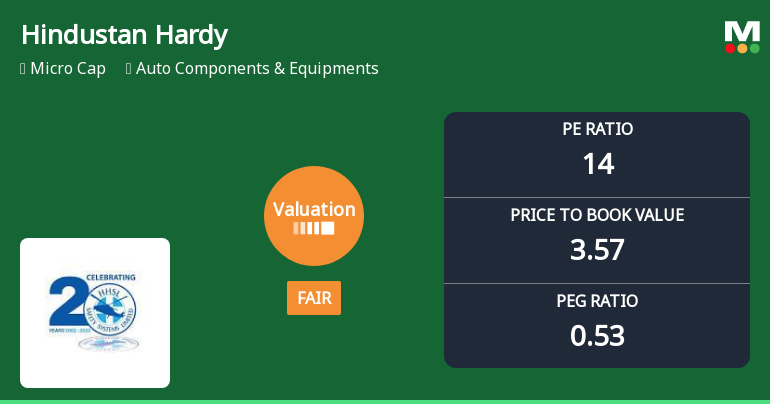
Hindustan Hardy Ltd Valuation Shifts to Fair Amidst Market Volatility
Hindustan Hardy Ltd, a micro-cap player in the Auto Components & Equipments sector, has seen a notable shift in its valuation parameters, moving from an expensive to a fair valuation grade. Despite recent price pressures, the stock’s price-to-earnings (P/E) and price-to-book value (P/BV) ratios now suggest improved price attractiveness relative to its historical averages and peer group, signalling a potential recalibration of investor sentiment.
Read full news article Announcements
Announcement under Regulation 30 (LODR)-Newspaper Publication
09-Jun-2026 | Source : BSEPursuant to the provisions of Regulation 47 (3) of SEBI (Listing Obligations and Disclosure Requirements) Regulations 2015 the newspaper Clipping regarding the proposed transfer of dividend and Equity Shares of the Company to IEPF authorities in respect of which the beneficial owner has not encashed any dividend warrant during last seven years published in The Free Press Journal (English) and Navashakti (Marathi) on 08th June 2026 are enclosed
Compliances-Reg.24(A)-Annual Secretarial Compliance
29-May-2026 | Source : BSEPursuant to Regulation 24A of the SEBI (Listing Obligations and Disclosure Requirements) Regulations 2015 read with relevant SEBI Circulars issued from time to time please find enclosed herewith the Annual Secretarial Compliance Report of the Company for the financial year ended 31st March 2026 issued by M/s Parikh and Associates Company Secretaries.
Shareholder Meeting / Postal Ballot-Outcome of Postal_Ballot
25-May-2026 | Source : BSEPursuant to provisions of Section 110 of the Companies Act 2013 read with the Companies (Management and Administration) Rules 2014 as amended the Company had conducted the process of Postal Ballot through remote e-voting for seeking the consent of the shareholders for passing Special Resolution as mentioned below Sr no Particulars 1 Appointment of Mr. Aurobind Ashabhai Patel (DIN: 00016628) as an Independent Director of the Company. In Compliance with the provisions of Regulations 44(3) of the LODR Section 108 of the Companies Act 2013 read with Rule 20 of the Companies (Management & Administration) Rules 2014 as amended The Company had provided e-voting facility to all its members to enable them to cast their vote on the matter listed in the Notice of Postal Ballot send only through electronic means (remote e-voting) during the period commenced from Saturday April 25 2026 at (10.00 a.m.) and ended on Sunday May 24 2026 at (5:00 p.m.).
Corporate Actions

No Upcoming Board Meetings

Hindustan Hardy Ltd has declared 28% dividend, ex-date: 09 Sep 25

No Splits history available

No Bonus history available

No Rights history available
Quality key factors
Valuation key factors
Technicals key factors
 Technical Indicator Scale: Bearish, Mildly Bearish, Sideways, Mildly Bullish, Bullish Turned
 Shareholding Snapshot : Mar 2026
Shareholding Compare (%holding)
Promoters
None
Held by 1 Schemes (0.0%)
Held by 0 FIIs
Xlo India Ltd (66.07%)
Hitesh Ramji Javeri (3.35%)
27.56%
Quarterly Results Snapshot (Standalone) - Mar'26 - QoQ

QoQ Growth in quarter ended Mar 2026 is 9.30% vs 6.99% in Dec 2025
QoQ Growth in quarter ended Mar 2026 is 18.99% vs -18.56% in Dec 2025
Half Yearly Results Snapshot (Standalone) - Sep'25
Growth in half year ended Sep 2025 is 42.88% vs 10.66% in Sep 2024
Growth in half year ended Sep 2025 is 80.22% vs 11.89% in Sep 2024
Nine Monthly Results Snapshot (Standalone) - Dec'25
YoY Growth in nine months ended Dec 2025 is 40.51% vs 13.18% in Dec 2024
YoY Growth in nine months ended Dec 2025 is 64.56% vs 9.72% in Dec 2024
Annual Results Snapshot (Standalone) - Mar'26
YoY Growth in year ended Mar 2026 is 33.57% vs 20.06% in Mar 2025

YoY Growth in year ended Mar 2026 is 27.16% vs 35.32% in Mar 2025
About Hindustan Hardy Ltd

Company Coordinates


