
Compare Hind.Oil Explor. with Similar Stocks
Dashboard
Strong ability to service debt as the company has a low Debt to EBITDA ratio of 0.46 times
Poor long term growth as Operating profit has grown by an annual rate 1.66% of over the last 5 years
The company has declared Negative results for the last 5 consecutive quarters
With ROE of 2.2, it has a Very Expensive valuation with a 1.5 Price to Book Value
Despite the size of the company, domestic mutual funds hold only 0% of the company
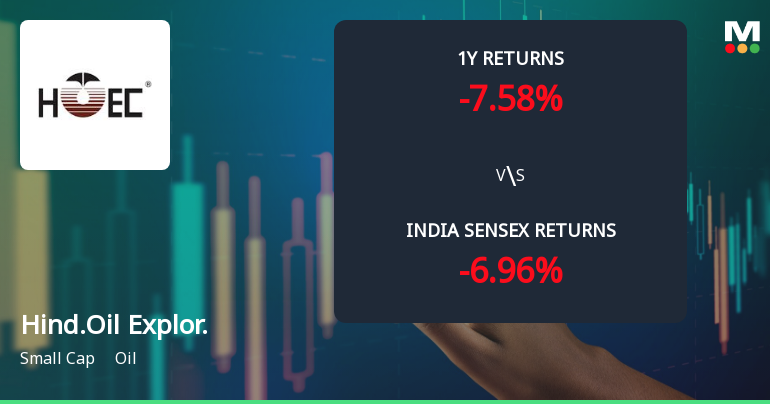
Consistent Underperformance against the benchmark over the last 3 years
Total Returns (Price + Dividend) 
Latest dividend: 0.5 per share ex-dividend date: Aug-23-2010
Risk Adjusted Returns v/s
Returns Beta

News
Hindustan Oil Exploration Company Ltd Technical Momentum Shifts Amid Mixed Market Signals
Hindustan Oil Exploration Company Ltd (HOEC) has experienced a nuanced shift in its technical parameters, moving from a bullish to a mildly bullish trend. Despite a recent 4.03% decline in the stock price to ₹158.40, the company’s technical indicators present a complex picture, with weekly and monthly signals diverging and suggesting cautious optimism for investors navigating the oil sector.
Read full news article
Hindustan Oil Exploration Company Ltd Upgraded to Hold on Technical Improvements Despite Financial Challenges
Hindustan Oil Exploration Company Ltd (HOEC) has seen its investment rating upgraded from Sell to Hold as of 22 June 2026, driven primarily by a marked improvement in technical indicators despite ongoing financial headwinds. The company’s Mojo Score now stands at 50.0, reflecting a more balanced outlook amid mixed fundamentals and market performance.
Read full news article
Hindustan Oil Exploration Company Ltd Sees Bullish Momentum Shift Amid Technical Upgrades
Hindustan Oil Exploration Company Ltd (HOEC) has witnessed a notable shift in its technical momentum, moving from a mildly bullish stance to a more confident bullish trend. This upgrade is supported by a confluence of technical indicators including MACD, moving averages, and Bollinger Bands, signalling renewed investor interest and potential upside in the small-cap oil sector stock.
Read full news article Announcements
Hindustan Oil Exploration Company Limited - Analysts/Institutional Investor Meet/Con. Call Updates
06-Nov-2019 | Source : NSEHindustan Oil Exploration Company Limitedy Limited has informed the Exchange regarding Analysts/Institutional Investor Meet/Con. Call Updates
Analysts\/Institutional Investor Meet\/Con. Call Updates
23-Sep-2019 | Source : NSE
| Hindustan Oil Exploration Company Limited has informed the Exchange regarding Analysts/Institutional Investor Meet/Con. Call Updates |
Updates
20-Sep-2019 | Source : NSE
| Hindustan Oil Exploration Company Limited has informed the Exchange regarding 'Intimation under Regulation 30 of the SEBI (Listing Obligations and Disclosure Requirements) Regulations, 2015'. |
Corporate Actions

No Upcoming Board Meetings

Hindustan Oil Exploration Company Ltd has declared 5% dividend, ex-date: 23 Aug 10

No Splits history available

No Bonus history available

Hindustan Oil Exploration Company Ltd has announced 2:3 rights issue, ex-date: 15 Nov 07
Quality key factors
Valuation key factors
Technicals key factors
 Technical Indicator Scale: Bearish, Mildly Bearish, Sideways, Mildly Bullish, Bullish Turned
 Shareholding Snapshot : Mar 2026
Shareholding Compare (%holding)
Non Institution
None
Held by 2 Schemes (0.0%)
Held by 31 FIIs (1.49%)
None
Ashok Kumar Goel (in Capacity Of Trustee - Ashok Goel Trust) (13.96%)
46.04%
Quarterly Results Snapshot (Consolidated) - Mar'26 - QoQ

QoQ Growth in quarter ended Mar 2026 is -373.14% vs -76.07% in Dec 2025
QoQ Growth in quarter ended Mar 2026 is -6.16% vs 192.58% in Dec 2025
Half Yearly Results Snapshot (Consolidated) - Sep'25

Growth in half year ended Sep 2025 is 70.45% vs -17.64% in Sep 2024
Growth in half year ended Sep 2025 is -11.44% vs -51.73% in Sep 2024
Nine Monthly Results Snapshot (Consolidated) - Dec'25
YoY Growth in nine months ended Dec 2025 is 24.26% vs -17.85% in Dec 2024
YoY Growth in nine months ended Dec 2025 is -42.76% vs -38.36% in Dec 2024
Annual Results Snapshot (Consolidated) - Mar'26
YoY Growth in year ended Mar 2026 is -37.47% vs -43.82% in Mar 2025
YoY Growth in year ended Mar 2026 is -57.37% vs -34.99% in Mar 2025
About Hindustan Oil Exploration Company Ltd

Company Coordinates


