
Compare Hindusthan Insul with Similar Stocks
Dashboard
Weak Long Term Fundamental Strength with a -0.81% CAGR growth in Net Sales over the last 5 years
- Low ability to service debt as the company has a high Debt to EBITDA ratio of 7.43 times
- The company has been able to generate a Return on Equity (avg) of 0.59% signifying low profitability per unit of shareholders funds
Negative results in Jun 25
Risky - Negative EBITDA
Despite the size of the company, domestic mutual funds hold only 0% of the company
Stock DNA
Other Electrical Equipment
INR 909 Cr (Micro Cap)
NA (Loss Making)
24
0.04%
0.96
-13.49%
2.67
Total Returns (Price + Dividend) 
Latest dividend: 0.5 per share ex-dividend date: Jun-19-2026
Risk Adjusted Returns v/s
Returns Beta

News
Hindusthan Insulators & Industries Ltd Shows Strong Technical Momentum Amid Market Challenges
Hindusthan Insulators & Industries Ltd, a micro-cap player in the Other Electrical Equipment sector, has demonstrated a notable shift in price momentum and technical indicators, signalling a transition from a mildly bullish to a bullish trend. With its current price touching a 52-week high of ₹1,259.65, the stock’s technical parameters reveal a complex but optimistic outlook for investors.
Read full news article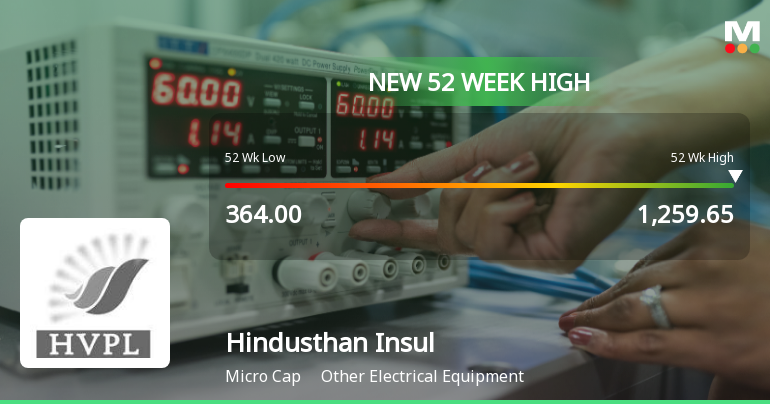
Broad-Based Technical Strength Lifts Hindusthan Insulators & Industries Ltd to 52-Week High of Rs 1259.65
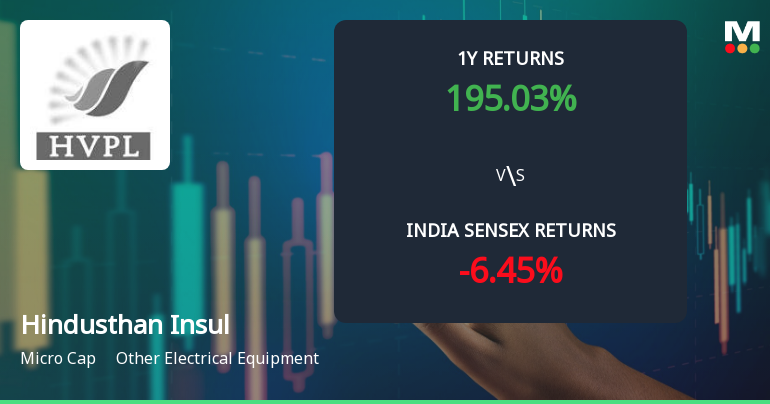
Surging to a new 52-week high of Rs 1259.65 on 22 Jun 2026, Hindusthan Insulators & Industries Ltd has demonstrated remarkable price momentum, outperforming its sector by nearly 1% today. This milestone caps a spectacular 195.03% rally over the past year, dwarfing the Sensex’s 6.31% decline over the same period.
Read full news article
Announcements
Issuance Of 2Nd Reminder For Dematerialization Of Securities To Shareholders Holding Shares In Physical Form -Intimation Under Regulation 30 Of The SEBI (Listing Obligations & Disclosure Requirements) Regulations 2015.
18-Jun-2026 | Source : BSEIssuance of 2nd Reminder letter
Intimation Regarding Communication To Shareholders On Deduction Of Tax At Source (TDS) On Dividend
02-Jun-2026 | Source : BSEIntimation regarding Communication to Shareholders on Deduction of Tax at Source (TDS) on Dividend
Announcement under Regulation 30 (LODR)-Newspaper Publication
02-Jun-2026 | Source : BSENewspaper Advertisement pursuant to Regulation 30 of SEBI (LODR) Regulations 2015
Corporate Actions

No Upcoming Board Meetings

Hindusthan Insulators & Industries Ltd has declared 25% dividend, ex-date: 19 Jun 26

Hindusthan Insulators & Industries Ltd has announced 2:10 stock split, ex-date: 13 Mar 26

No Bonus history available

No Rights history available
Quality key factors
Valuation key factors
Technicals key factors
 Technical Indicator Scale: Bearish, Mildly Bearish, Sideways, Mildly Bullish, Bullish Turned
 Shareholding Snapshot : Mar 2026
Shareholding Compare (%holding)
Promoters
None
Held by 0 Schemes
Held by 0 FIIs
Hindusthan Consultancy And Services Limited (49.13%)
Ashok Kumar Gupta (4.45%)
20.36%
Quarterly Results Snapshot (Standalone) - Mar'26 - YoY

YoY Growth in quarter ended Mar 2026 is 29.80% vs 13.64% in Mar 2025
YoY Growth in quarter ended Mar 2026 is 174.41% vs -8,681.25% in Mar 2025
Half Yearly Results Snapshot (Standalone) - Sep'25

Growth in half year ended Sep 2025 is 11.47% vs 17.82% in Sep 2024
Growth in half year ended Sep 2025 is -268.33% vs 2,013.33% in Sep 2024
Nine Monthly Results Snapshot (Standalone) - Dec'25
YoY Growth in nine months ended Dec 2025 is 22.03% vs 22.59% in Dec 2024
YoY Growth in nine months ended Dec 2025 is -209.51% vs 1,103.44% in Dec 2024
Annual Results Snapshot (Standalone) - Mar'26
YoY Growth in year ended Mar 2026 is 24.45% vs 19.67% in Mar 2025
YoY Growth in year ended Mar 2026 is -337.22% vs 38.78% in Mar 2025
About Hindusthan Insulators & Industries Ltd

Company Coordinates


