
Compare Hipolin with Similar Stocks
Dashboard
Weak Long Term Fundamental Strength with an average Return on Equity (ROE) of 0%
- Poor long term growth as Net Sales has grown by an annual rate of -3.12% over the last 5 years
- Company's ability to service its debt is weak with a poor EBIT to Interest (avg) ratio of -1.69
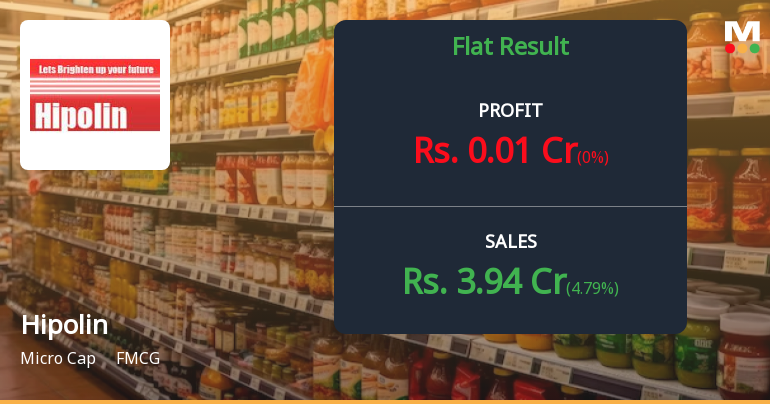
Flat results in Mar 26
Risky - Negative EBITDA
Reducing Promoter Confidence
Consistent Underperformance against the benchmark over the last 3 years
Total Returns (Price + Dividend) 
Latest dividend: 1.0000 per share ex-dividend date: Sep-23-2010
Risk Adjusted Returns v/s
Returns Beta

News
Hipolin Ltd Q4 FY26: Marginal Profit Recovery Masks Deeper Structural Challenges
Hipolin Ltd., a micro-cap FMCG company with a market capitalisation of ₹28.00 crores, reported marginal profitability in Q4 FY26 (Mar'26), posting a net profit of ₹0.01 crores compared to a loss of ₹2.36 crores in the same quarter last year. However, this technical recovery masks significant underlying concerns, as revenue declined 10.45% year-on-year to ₹3.94 crores, and the company continues to struggle with negative return on equity of -49.53%. The stock has declined 1.99% following the results announcement, trading at ₹89.14 and reflecting investor scepticism about the sustainability of this fragile turnaround.
Read full news articleAre Hipolin Ltd latest results good or bad?
Hipolin Ltd's latest financial results for Q3 FY26 indicate a company grappling with significant operational challenges. The net profit for the quarter was reported at ₹0.01 crores, reflecting a marginal year-on-year increase, but this was achieved with a very thin profit margin of 0.27%. This suggests that while the company technically returned to profitability, the underlying operational health remains fragile. In terms of revenue, Hipolin reported ₹3.76 crores, which represents a year-on-year decline of 25.40%. However, there was a sequential improvement of 18.24% compared to the previous quarter, indicating some stabilization after a challenging first half of the fiscal year. Despite this recovery, the overall revenue trajectory remains concerning, particularly given the severe 50.53% year-on-year drop experienced in Q1 FY26. The operating margin stood at -1.60%, highlighting the company's ongoing st...
Read full news article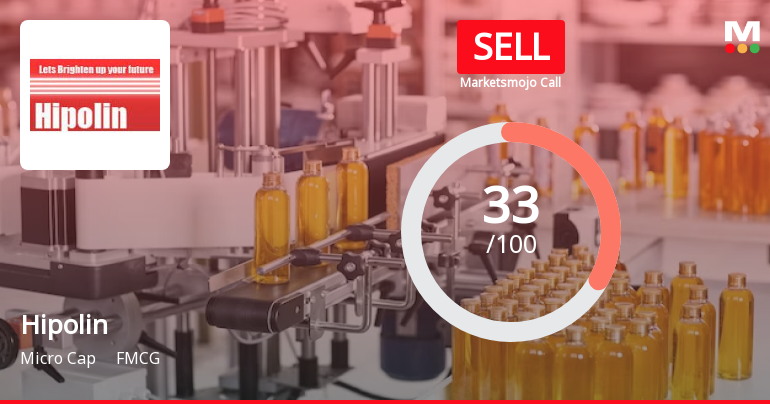
Hipolin Ltd Upgraded to 'Sell' as Technicals Improve Despite Weak Fundamentals
Hipolin Ltd, a micro-cap player in the FMCG sector, has seen its investment rating upgraded from Strong Sell to Sell as of 26 May 2026. This change is primarily driven by a shift in technical indicators, even as the company continues to grapple with weak financial fundamentals and valuation concerns. Investors should weigh the improved technical outlook against persistent operational challenges before making decisions.
Read full news article Announcements
Announcement under Regulation 30 (LODR)-Newspaper Publication
03-Jun-2026 | Source : BSENewspaper publication of Audited financial results for the quarter and year ended 31st March 2026.
Audited Financial Results For The Quarter And Year Ended 31St March 2026
29-May-2026 | Source : BSETo consider and approve audited standalone and consolidated financial results for the quarter and year ended 31st March 2026.
Audited Financial Results For The Quarter And Year Ended 31St March 2026.
29-May-2026 | Source : BSETo consider and approve Audited standalone and consolidated Financial statements for the quarter and year ended 31st March 2026.
Corporate Actions

No Upcoming Board Meetings

Hipolin Ltd has declared 10% dividend, ex-date: 23 Sep 10

No Splits history available

No Bonus history available

No Rights history available
Quality key factors
Valuation key factors
Technicals key factors
 Technical Indicator Scale: Bearish, Mildly Bearish, Sideways, Mildly Bullish, Bullish Turned
 Shareholding Snapshot : Mar 2026
Shareholding Compare (%holding)
Promoters
None
Held by 0 Schemes
Held by 0 FIIs
Kinnari Vaibhav Shah (18.75%)
Dipak Kanayalal Shah (1.66%)
35.02%
Quarterly Results Snapshot (Consolidated) - Mar'26 - QoQ

QoQ Growth in quarter ended Mar 2026 is 4.79% vs 18.24% in Dec 2025
QoQ Growth in quarter ended Mar 2026 is 0.00% vs 0.00% in Dec 2025
Half Yearly Results Snapshot (Consolidated) - Sep'25
Growth in half year ended Sep 2025 is -46.83% vs 42.37% in Sep 2024
Growth in half year ended Sep 2025 is -121.21% vs 54.79% in Sep 2024
Nine Monthly Results Snapshot (Consolidated) - Dec'25
YoY Growth in nine months ended Dec 2025 is -40.54% vs 23.70% in Dec 2024

YoY Growth in nine months ended Dec 2025 is 20.00% vs -25.00% in Dec 2024
Annual Results Snapshot (Consolidated) - Mar'26
YoY Growth in year ended Mar 2026 is -34.37% vs 9.28% in Mar 2025
YoY Growth in year ended Mar 2026 is 76.52% vs -268.54% in Mar 2025
About Hipolin Ltd

Company Coordinates


