
Compare HLE Glascoat with Similar Stocks
Dashboard
High Management Efficiency with a high ROCE of 15.84%
Poor long term growth as Operating profit has grown by an annual rate 4.52% of over the last 5 years
Positive results in Mar 26
With ROCE of 12.6, it has a Attractive valuation with a 3.5 Enterprise value to Capital Employed
Increasing Participation by Institutional Investors
Consistent Underperformance against the benchmark over the last 3 years
Stock DNA
Industrial Manufacturing
INR 2,524 Cr (Small Cap)
48.00
37
0.29%
0.54
10.03%
4.79
Total Returns (Price + Dividend) 
Latest dividend: 1.1 per share ex-dividend date: Sep-19-2025
Risk Adjusted Returns v/s
Returns Beta

News
HLE Glascoat Ltd Downgraded to Hold Amid Mixed Financial and Technical Signals
HLE Glascoat Ltd, a small-cap player in the industrial manufacturing sector, has seen its investment rating downgraded from Buy to Hold as of 8 June 2026. This adjustment reflects a nuanced assessment across four key parameters: quality, valuation, financial trend, and technical indicators. Despite positive quarterly financial results and improving technical signals, concerns over long-term growth and relative underperformance have tempered enthusiasm among analysts.
Read full news article
HLE Glascoat Ltd Upgraded to Buy on Improved Technicals and Financial Metrics
HLE Glascoat Ltd, a small-cap player in the industrial manufacturing sector, has seen its investment rating upgraded from Hold to Buy, reflecting a notable improvement in its technical indicators and solid financial performance. The upgrade, effective from 3 June 2026, follows a comprehensive reassessment of the company’s quality, valuation, financial trends, and technical outlook, signalling renewed investor confidence amid mixed long-term returns.
Read full news article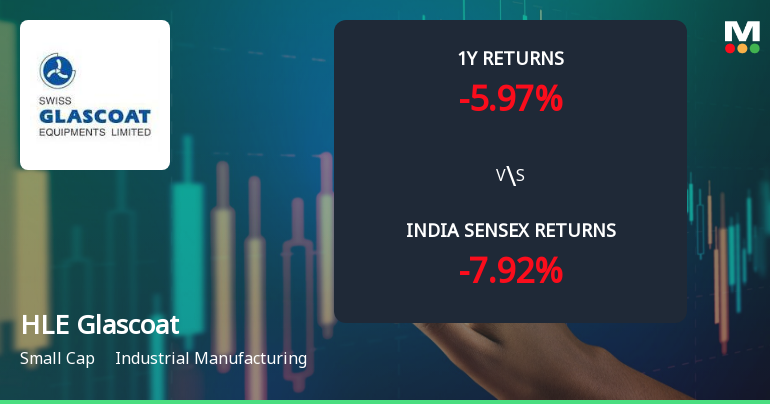
HLE Glascoat Ltd Shows Renewed Momentum Amid Technical Upgrades
HLE Glascoat Ltd, a small-cap player in the industrial manufacturing sector, has witnessed a notable shift in its technical momentum, signalling a transition from a sideways trend to a mildly bullish phase. This change is underscored by a robust price surge of 8.28% on 4 June 2026, with the stock closing at ₹391.65, up from the previous close of ₹361.70. The evolving technical indicators suggest a cautiously optimistic outlook for investors amid mixed signals across different timeframes.
Read full news article Announcements
Announcement under Regulation 30 (LODR)-Earnings Call Transcript
01-Jun-2026 | Source : BSEEarnings Call Transcript for Q4 & year ended FY 2025-26.
Compliances-Reg.24(A)-Annual Secretarial Compliance
29-May-2026 | Source : BSEAnnual Secretarial Compliance report for the financial year 2025-26.
Announcement under Regulation 30 (LODR)-Meeting Updates
25-May-2026 | Source : BSEHLE Glascoat Limited has informed the Exchange about Link of Recording of the Earnings Call held on 25/05/2026 for the period ended on 31/03/2026.
Corporate Actions

No Upcoming Board Meetings

HLE Glascoat Ltd has declared 55% dividend, ex-date: 19 Sep 25

HLE Glascoat Ltd has announced 2:10 stock split, ex-date: 18 Oct 22

No Bonus history available

No Rights history available
Quality key factors
Valuation key factors
Technicals key factors
 Technical Indicator Scale: Bearish, Mildly Bearish, Sideways, Mildly Bullish, Bullish Turned
 Shareholding Snapshot : Mar 2026
Shareholding Compare (%holding)
Promoters
None
Held by 2 Schemes (3.46%)
Held by 13 FIIs (2.27%)
Nilesh Khushalbhai Patel (24.77%)
Overseas Pearl Ltd (3.58%)
19.46%
Quarterly Results Snapshot (Consolidated) - Mar'26 - QoQ

QoQ Growth in quarter ended Mar 2026 is 19.94% vs -6.90% in Dec 2025
QoQ Growth in quarter ended Mar 2026 is 542.76% vs -76.40% in Dec 2025
Half Yearly Results Snapshot (Consolidated) - Sep'25
Growth in half year ended Sep 2025 is 37.13% vs 9.78% in Sep 2024
Growth in half year ended Sep 2025 is 76.51% vs -16.72% in Sep 2024
Nine Monthly Results Snapshot (Consolidated) - Dec'25
YoY Growth in nine months ended Dec 2025 is 38.54% vs 5.00% in Dec 2024
YoY Growth in nine months ended Dec 2025 is 27.05% vs 10.13% in Dec 2024
Annual Results Snapshot (Consolidated) - Mar'26
YoY Growth in year ended Mar 2026 is 31.67% vs 6.16% in Mar 2025

YoY Growth in year ended Mar 2026 is 5.80% vs 57.33% in Mar 2025
About HLE Glascoat Ltd

Company Coordinates


