
Compare HLV with Similar Stocks
Dashboard
Weak Long Term Fundamental Strength with an average Return on Equity (ROE) of 2.78%
- Poor long term growth as Operating profit has grown by an annual rate 13.97% of over the last 5 years
- Company's ability to service its debt is weak with a poor EBIT to Interest (avg) ratio of -0.50
Negative results in Mar 26
Risky - Negative Operating Profits
36.49% of Promoter Shares are Pledged
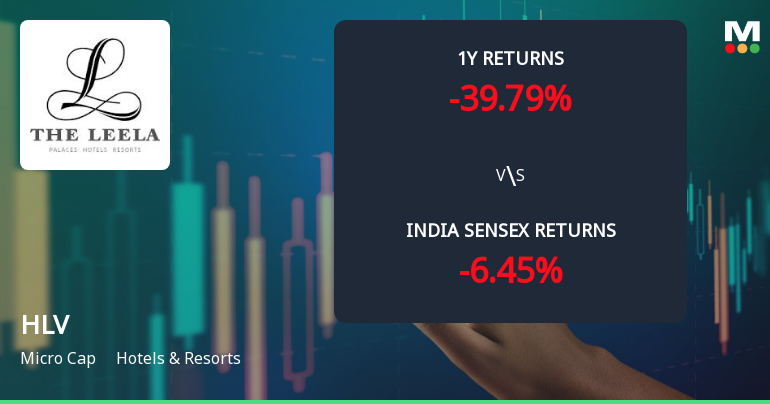
Underperformed the market in the last 1 year
Stock DNA
Hotels & Resorts
INR 529 Cr (Micro Cap)
102.00
38
0.00%
-0.21
1.08%
1.12
Total Returns (Price + Dividend) 
Latest dividend: 0.16 per share ex-dividend date: Jun-21-2011
Risk Adjusted Returns v/s
Returns Beta

News
HLV Ltd Technical Momentum Shifts Amid Persistent Downtrend
HLV Ltd, a micro-cap player in the Hotels & Resorts sector, has exhibited a subtle shift in technical momentum, moving from a bearish to a mildly bearish trend. Despite a modest uptick in price to ₹7.93 on 23 Jun 2026, the stock continues to face significant headwinds, reflected in its strong sell Mojo Grade of 9.0 and deteriorating long-term returns relative to the Sensex.
Read full news article
HLV Ltd is Rated Strong Sell
HLV Ltd is rated Strong Sell by MarketsMOJO, with this rating last updated on 01 August 2025. However, the analysis and financial metrics discussed here reflect the company’s current position as of 21 June 2026, providing investors with the latest insights into the stock’s performance and outlook.
Read full news article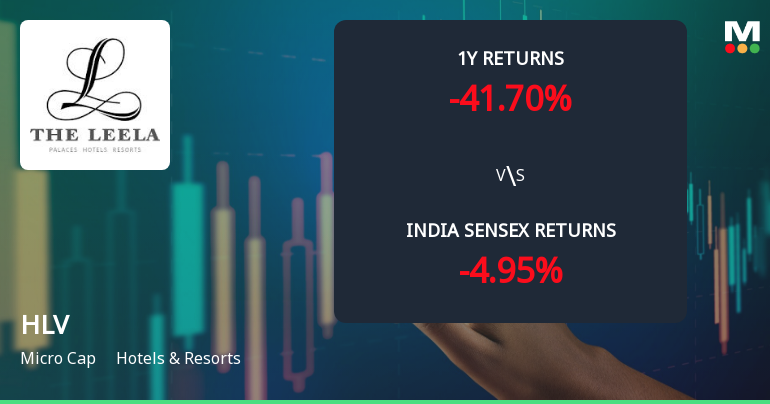
HLV Ltd Technical Momentum Shifts Amid Bearish Market Sentiment
HLV Ltd, a micro-cap player in the Hotels & Resorts sector, has experienced a notable shift in its technical momentum, with key indicators signalling a bearish trend. Despite some mildly bullish weekly signals, the overall technical landscape points to deteriorating price strength and investor caution as the stock trades near ₹7.90, down 1.25% on the day.
Read full news article Announcements
Announcement under Regulation 30 (LODR)-Newspaper Publication
13-May-2026 | Source : BSENewpaper Clipping of Financial Results for the fourth Quarter and financial year ended March 31 2026
Announcement under Regulation 30 (LODR)-Change in Management
12-May-2026 | Source : BSEAppointment of Internal Auditor for Financial Year 2026-27
Board Meeting Outcome for Outcome Of Board Meeting - Audited Financial Results For The Fourth Quarter And Year Ended March 31 2026
12-May-2026 | Source : BSEAudited Financial Results for the fourth quarter and year ended March 31 2026
Corporate Actions

No Upcoming Board Meetings

HLV Ltd has declared 8% dividend, ex-date: 21 Jun 11

HLV Ltd has announced 2:10 stock split, ex-date: 08 Sep 06

No Bonus history available

No Rights history available
Quality key factors
Valuation key factors
Technicals key factors
 Technical Indicator Scale: Bearish, Mildly Bearish, Sideways, Mildly Bullish, Bullish Turned
 Shareholding Snapshot : Mar 2026
Shareholding Compare (%holding)
Non Institution
36.4906
Held by 1 Schemes (0.0%)
Held by 9 FIIs (0.16%)
Universal Hotels & Resorts Private Limited (36.47%)
Itc Limited (4.86%)
22.29%
Quarterly Results Snapshot (Standalone) - Mar'26 - YoY

YoY Growth in quarter ended Mar 2026 is 7.07% vs -0.80% in Mar 2025

YoY Growth in quarter ended Mar 2026 is -19.93% vs 3.77% in Mar 2025
Half Yearly Results Snapshot (Standalone) - Sep'25
Growth in half year ended Sep 2025 is -11.30% vs 2.77% in Sep 2024
Growth in half year ended Sep 2025 is -362.04% vs 30.36% in Sep 2024
Nine Monthly Results Snapshot (Standalone) - Dec'25
YoY Growth in nine months ended Dec 2025 is -4.57% vs 3.37% in Dec 2024
YoY Growth in nine months ended Dec 2025 is -142.39% vs 14.35% in Dec 2024
Annual Results Snapshot (Standalone) - Mar'26
YoY Growth in year ended Mar 2026 is -1.18% vs 2.11% in Mar 2025
YoY Growth in year ended Mar 2026 is -92.04% vs 9.79% in Mar 2025
About HLV Ltd

Company Coordinates


