HLV

  • Market Cap: Micro Cap
  • Industry: Hotels & Resorts
  • ISIN: INE102A01024
  • NSEID: HLVLTD
  • BSEID: 500193
INR
6.39
0.01 (0.16%)
BSENSE

Sep 11, 11:05 AM

BSE+NSE Vol: 38.3 k

  • Price Points
  • Score
  • Mojo Parameters
  • Total Return
  • News and Corporate Actions
  • Key factors
  • Shareholding
  • Financials
  • CompanyCV
stock-summaryPrice Point
High/Low

1Day

52 Week

Valuation
Technical
Day's Volume

CASH

38.3 k (-43.95%) Volume

Shareholding (Jun 2026)

FII

0.03%

Held by 5 FIIs

DII

1.53%

Held by 3 DIIs

Promoter

39.07%

Why is HLV Ltd falling/rising?

06-Sep-2026

As of 05-Sep, HLV Ltd's stock price is experiencing a short-term rise, currently at 6.49, but faces significant long-term challenges with a year-to-date drop of 28.45% and a decline in investor participation.

As of 05-Sep, HLV Ltd's stock price is rising, currently at 6.49, with a change of 0.12, representing an increase of 1.88%. This upward movement is notable as the stock has been gaining for the last two days, achieving a total return of 2.69% during this period. Additionally, it has outperformed its sector by 2.96% today. <BR><BR>Despite this recent rise, it is important to consider the broader context of the stock's performance. Over the past week, HLV Ltd has experienced a decline of 1.07%, and its year-to-date performance shows a significant drop of 28.45%. The stock's performance over the past year is also concerning, with a decrease of 45.28%. <BR><BR>Investor participation appears to be declining, as evidenced by a 1.47% drop in delivery volume compared to the 5-day average. Furthermore, while the stock is currently above its 5-day moving average, it remains below its 20-day, 50-day, 100-day, and 200-day moving averages, indicating that it may still be under pressure in the longer term.<BR><BR>In summary, HLV Ltd is experiencing a short-term rise in its stock price, driven by recent gains and sector outperformance, but it faces significant challenges reflected in its longer-term performance metrics and declining investor participation.

View full answer

Who are in the management team of HLV?

01-Sep-2026

The management team of HLV includes Vivek Nair (Chairman & Managing Director), Dinesh Nair (Co-Chairman & Managing Director), and several non-executive and independent directors, including Saija Nair and Ashok Girdharidas Rajani, along with Savitri Yadav as Company Secretary & Compliance Officer. This diverse team provides both leadership and oversight for the company.

The management team of HLV includes the following individuals:<BR><BR>1. **Vivek Nair** - Chairman & Managing Director<BR>2. **Dinesh Nair** - Co-Chairman & Managing Director<BR>3. **Saija Nair** - Non-Executive & Independent Director<BR>4. **Madhu Nair** - Non-Executive & Non-Independent Director<BR>5. **Amruda Nair** - Non-Executive & Non-Independent Director<BR>6. **Ashok Girdharidas Rajani** - Non-Executive & Independent Director<BR>7. **Shereveer Vakil** - Independent Director<BR>8. **Niranjana Unnikrishnan** - Independent Director<BR>9. **Savitri Yadav** - Company Secretary & Compliance Officer<BR><BR>This team brings a mix of executive leadership and independent oversight to the company.

View full answer

What does HLV do?

01-Sep-2026

HLV Ltd is an Indian hospitality company that owns and manages hotels and resorts, formerly known as Hotel Leela Venture Ltd. As of June 2026, it reported net sales of 47 Cr and a net loss of 1 Cr, with a market cap of INR 431 Cr.

Overview: <BR>HLV Ltd is a leading player in the Indian hospitality industry, engaged in owning, operating, and managing hotels, palaces, and resorts, and falls under the micro-cap category.<BR><BR>History: <BR>HLV Ltd was incorporated in March 1981 and was formerly known as Hotel Leela Venture Ltd, with the name change occurring on 22 October 2019. The latest quarterly results reported net sales and profit for June 2026.<BR><BR>Financial Snapshot: <BR>Most recent Net Sales: 47 Cr (Quarterly Results - Jun 2026) <BR>Most recent Net Profit: -1 Cr (Quarterly Results - Jun 2026) <BR>Market-cap value: INR 431 Cr (Micro Cap) <BR><BR>Key Metrics: <BR>P/E: 55.00 <BR>Industry P/E: 36 <BR>Dividend Yield: 0.00% <BR>Debt-Equity: -0.21 <BR>Return on Equity: 1.66% <BR>Price to Book: 0.92 <BR><BR>Contact Details: <BR>Address: The Leela, Sahar Mumbai Maharashtra : 400059 <BR>Phone: 91-22-66911182/83 <BR>Email: investor.service@hlvltd.com <BR>Website: http://www.hlvltd.com

View full answer

Who are the peers of the HLV?

01-Sep-2026

HLV's peers include Praveg, Kamat Hotels, Sayaji Hotels, Emerald Leisures, Advani Hotels, Sinclairs Hotels, Sayaji (Indore), Robust Hotels, and Apollo Sindoori. In terms of performance, Emerald Leisures has the highest 1-year return at 29.44%, while HLV has the lowest at -44.23%.

Peers: The peers of HLV are Praveg, Kamat Hotels, Sayaji Hotels, Emerald Leisures, Advani Hotels, Sinclairs Hotels, Sayaji (Indore), Robust Hotels, and Apollo Sindoori.<BR><BR>Quality Snapshot: Excellent management risk is observed at Advani Hotels and Sinclairs Hotels, while Average management risk is found at Praveg and Kamat Hotels, and Below Average management risk is seen at Sayaji Hotels, Sayaji (Indore), Robust Hotels, and Apollo Sindoori. Growth is Excellent at Kamat Hotels and Advani Hotels, while Average growth is noted at HLV, Good growth is seen at Robust Hotels, and Below Average growth is found at Sayaji Hotels and Sayaji (Indore). Capital Structure is Excellent at Advani Hotels and Sinclairs Hotels, Good at HLV, and Below Average at Kamat Hotels and Robust Hotels, while Emerald Leisures does not qualify.<BR><BR>Return Snapshot: The peer with the highest 1-year return is Emerald Leisures at 29.44%, while the peer with the lowest is HLV at -44.23%. HLV's 1-year return is significantly lower than all its peers. Additionally, the six-month return is negative for Kamat Hotels, Advani Hotels, Robust Hotels, and HLV.

View full answer

How big is HLV?

01-Sep-2026

As of 31st August, HLV Ltd has a market capitalization of 431.00 Cr, with Net Sales of 145.68 Cr and a Net Profit of 193.71 Cr over the latest four quarters. The company reports Shareholder's Funds of 457.37 Cr and Total Assets of 659.70 Cr.

As of 31st August, HLV Ltd has a market capitalization of 431.00 Cr, categorizing it as a Micro Cap company.<BR><BR>In the latest four quarters, HLV Ltd reported Net Sales of 145.68 Cr and a Net Profit of 193.71 Cr.<BR><BR>The latest annual period for HLV Ltd shows Shareholder's Funds of 457.37 Cr and Total Assets amounting to 659.70 Cr.

View full answer

Should I buy, sell or hold HLV Ltd?

29-Jul-2026

When is the next results date for HLV Ltd?

21-Jul-2026

The next results date for HLV Ltd is 28 July 2026.

The next results date for HLV Ltd is scheduled for 28 July 2026.

View full answer

Are HLV Ltd latest results good or bad?

12-Feb-2026

HLV Ltd's latest results are unfavorable, showing a consolidated net loss of ₹16.87 crores despite record net sales of ₹60.90 crores, indicating significant operational challenges and poor cost management. Year-on-year, the company's performance has worsened, raising concerns about its ability to achieve sustainable profitability.

HLV Ltd's latest results are concerning. Despite achieving their highest quarterly net sales of ₹60.90 crores, the company reported a consolidated net loss of ₹16.87 crores, which reflects a dramatic sequential decline of 108.37% from the previous quarter's profit. This indicates severe operational challenges, particularly in cost management, as the operating margin (excluding other income) was deeply negative at -37.21%.<BR><BR>Year-on-year, the company's performance has also deteriorated, with a net loss that represents a 43.43% decline compared to the same period last year. The return on equity is weak at just 2.19%, signaling inefficiency in capital utilization. Additionally, employee costs accounted for a significant 39.5% of revenue, further straining profitability.<BR><BR>Overall, the financial performance raises serious questions about the company's operational efficiency and its ability to generate sustainable profits, making the latest results unfavorable.

View full answer

Is HLV overvalued or undervalued?

18-Nov-2025

As of November 17, 2025, HLV is considered overvalued and risky due to its high PE ratio of 63.87, an EV to EBITDA of 31.80, a low ROE of 2.19%, and a year-to-date stock performance of -46.00%, significantly underperforming compared to its peers and the market.

As of 17 November 2025, the valuation grade for HLV has moved from attractive to risky, indicating a significant shift in its perceived financial health. The company is currently considered overvalued, primarily due to its high PE ratio of 63.87 and an EV to EBITDA ratio of 31.80, which are both substantially above the industry average. Additionally, the return on equity (ROE) stands at a mere 2.19%, raising concerns about profitability relative to shareholder equity.<BR><BR>In comparison to its peers, HLV's valuation metrics are alarming. For instance, Indian Hotels Co has a PE ratio of 61.02 and an EV to EBITDA of 34.87, while ITC Hotels shows a PE of 62.61 and an EV to EBITDA of 35.53, both of which are still lower than HLV's ratios. The company's stock performance has also lagged significantly, with a year-to-date return of -46.00%, contrasting sharply with the Sensex's gain of 8.72% over the same period. This combination of high valuation ratios and poor stock performance solidifies the view that HLV is overvalued in the current market context.

View full answer

How has been the historical performance of HLV?

14-Nov-2025

HLV's historical performance has shown significant volatility, with net sales declining from 154.34 Cr in March 2019 to 145.68 Cr in March 2020, while total assets and liabilities dropped to 659.70 Cr. Despite ongoing losses, the consolidated net profit turned positive at 193.71 Cr in 2020, indicating a recovery amidst substantial operational restructuring.

Answer:<BR>The historical performance of HLV shows significant fluctuations over the years, particularly in net sales and profitability. In March 2020, net sales were reported at 145.68 Cr, a decrease from 154.34 Cr in March 2019 and a notable drop from 698.02 Cr in March 2017. The total operating income mirrored this trend, with a decline to 145.68 Cr in 2020 from 154.34 Cr in 2019. The total expenditure, excluding depreciation, increased to 182.63 Cr in 2020 from 156.69 Cr in 2019, leading to an operating profit (PBDIT) of -30.44 Cr in 2020, down from 1.83 Cr in 2019. The profit before tax also worsened, resulting in -20.19 Cr in 2020 compared to -37.80 Cr in 2019. The profit after tax for 2020 was -20.19 Cr, an improvement from -37.80 Cr in 2019, indicating a slight recovery despite ongoing losses. The consolidated net profit turned positive at 193.71 Cr in 2020 after being negative in previous years. The earnings per share (EPS) improved to 3.07 in 2020 from -1.89 in 2019. <BR><BR>In terms of assets and liabilities, total assets decreased significantly to 659.70 Cr in March 2020 from 4,188.77 Cr in March 2019, while total liabilities also fell to 659.70 Cr from 4,188.77 Cr in the same period. The company’s cash flow from operating activities was 138.00 Cr in 2020, down from 209.00 Cr in 2019, while cash flow from investing activities surged to 3,823.00 Cr, indicating substantial investment activity. However, cash flow from financing activities saw a significant outflow of -3,976.00 Cr in 2020, leading to a net cash outflow of -13.00 Cr. Overall, HLV's performance reflects a challenging environment with significant restructuring and operational adjustments over the years.<BR><BR>Breakdown:<BR>HLV's financial performance has been marked by considerable volatility, particularly in net sales, which decreased from 154.34 Cr in March 2019 to 145.68 Cr in March 2020, following a peak of 698.02 Cr in March 2017. This decline in revenue was accompanied by an increase in total expenditure, which rose to 182.63 Cr in 2020, resulting in an operating profit of -30.44 Cr, down from a slight profit of 1.83 Cr in the previous year. The company reported a profit before tax of -20.19 Cr in 2020, an improvement from -37.80 Cr in 2019, while the profit after tax also showed a similar trend, reflecting a loss of -20.19 Cr in 2020 compared to -37.80 Cr in 2019. The consolidated net profit turned positive at 193.71 Cr in 2020, a significant recovery from the previous years' losses. On the balance sheet, total assets and liabilities both decreased dramatically to 659.70 Cr in March 2020, indicating a major contraction in the company's financial structure. Cash flow from operating activities was 138.00 Cr, while cash flow from investing activities surged to 3,823.00 Cr, suggesting aggressive investment strategies despite the overall cash outflow of -13.00 Cr for the year.

View full answer

Is HLV technically bullish or bearish?

08-Oct-2025

As of October 7, 2025, HLV's technical trend has shifted to bearish, driven by negative signals from moving averages and Bollinger Bands, despite some conflicting indicators suggesting mild bullishness.

As of 7 October 2025, the technical trend for HLV has changed from mildly bearish to bearish. The current technical stance is bearish with moderate strength. Key indicators driving this stance include the bearish signal from the daily moving averages and the weekly KST, both indicating downward momentum. The MACD shows a conflicting mildly bullish signal on the weekly timeframe but is bearish on the monthly, which adds to the overall bearish sentiment. The Bollinger Bands are bearish on the weekly and mildly bearish on the monthly, further supporting the negative outlook. The Dow Theory indicates a mildly bearish stance on the weekly, while the monthly shows a mildly bullish perspective, suggesting mixed signals. Overall, the bearish trend is reinforced by the recent price action and the broader context of the stock's performance relative to the market.

View full answer

Who are the top shareholders of the HLV?

17-Jul-2025

The top shareholders of HLV are Universal Hotels & Resorts Private Limited with 36.47%, Jm Financial Asset Reconstruction Company Limited at 24.87%, and individual investors holding 22.21%. Additionally, 14 foreign institutional investors hold a combined 0.08%, while mutual funds hold no shares.

The top shareholders of HLV include Universal Hotels & Resorts Private Limited, which holds the largest share at 36.47%. Additionally, Jm Financial Asset Reconstruction Company Limited is the highest public shareholder with a stake of 24.87%. The company also has a significant portion of individual investors holding 22.21% of the shares. It's worth noting that there are 14 foreign institutional investors (FIIs) with a combined holding of 0.08%, and mutual funds currently hold no shares in the company.

View full answer

Has HLV declared dividend?

06-Jun-2025

HLV Ltd has declared an 8% dividend, amounting to 0.16 per share, with an ex-date of June 21, 2011. However, the dividend yield is 0%, and total returns have varied significantly, showing negative returns in the short term but positive returns over longer periods.

HLV Ltd has declared an 8% dividend.<BR><BR>Dividend Details:<BR>- Percentage announced: 8%<BR>- Amount per share: 0.16<BR>- Ex-date: Jun-21-2011<BR><BR>Dividend Yield: 0%<BR><BR>Total Returns by Period:<BR>Over the 6-month period, the price return was -31.35%, the dividend return was 0%, resulting in a total return of -31.35%.<BR><BR>For the 1-year period, the price return was -47.68%, the dividend return was 0%, leading to a total return of -47.68%.<BR><BR>In the 2-year period, the price return was 13.97%, the dividend return was 0%, culminating in a total return of 13.97%.<BR><BR>During the 3-year period, the price return was 49.34%, the dividend return was 0%, resulting in a total return of 49.34%.<BR><BR>For the 4-year period, the price return was 25.99%, the dividend return was 0%, leading to a total return of 25.99%.<BR><BR>In the 5-year period, the price return was 153.16%, the dividend return was 0%, culminating in a total return of 153.16%.<BR><BR>Overall, HLV Ltd has declared a dividend, but the dividend yield remains at 0%, indicating that the dividends have not contributed to the returns in recent periods. The total returns show significant variability, with positive returns over longer periods despite recent declines.

View full answer
iScoreScore
Click here to find our call on this stock
Strong Sell
Sell
Hold
Buy
Strong Buy

Dashboard

1

Weak Long Term Fundamental Strength with an average Return on Equity (ROE) of 2.78%

  • Poor long term growth as Operating profit has grown by an annual rate 14.46% of over the last 5 years
  • Company's ability to service its debt is weak with a poor EBIT to Interest (avg) ratio of 0.81
2

Flat results in Jun 26

 
3

Risky - Negative Operating Profits

4

36.49% of Promoter Shares are Pledged

5

Consistent Underperformance against the benchmark over the last 3 years

stock-summaryMojo Parameters

Mojo Parameters

Loading Valuation Snapshot...

Stock DNA

stock-summary
Industry

Hotels & Resorts

stock-summary
Market cap

INR 421 Cr (Micro Cap)

stock-summary
P/E

54.00

stock-summary
Industry P/E

36

stock-summary
Dividend Yield

0.00%

stock-summary
Debt Equity

-0.21

stock-summary
Return on Equity

1.66%

stock-summary
Price to Book

0.89

Revenue and Profits:
Net Sales:
47 Cr
(Quarterly Results - Jun 2026)
Net Profit:
-1 Cr
stock-summaryTotal Returns
Total Returns (Price + Dividend) stock-summary
Dividend Yield (0%)
TimePeriod
Price Return
Dividend Return
Total Return
3 Months
-16.58%
0%
-16.58%
6 Months
-16.14%
0%
-16.14%
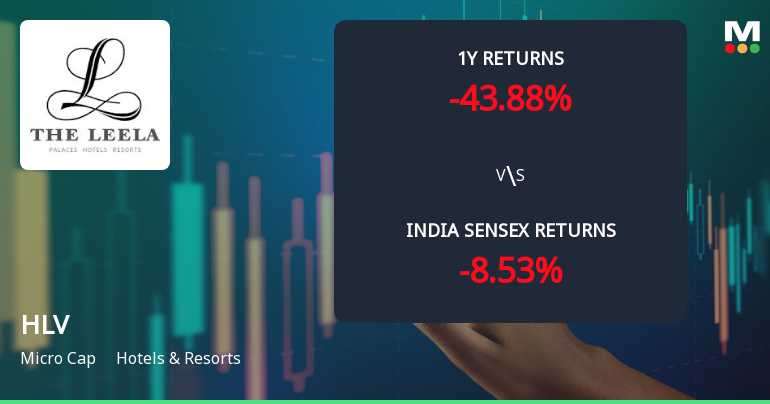
1 Year
-46.12%
0%
-46.12%
2 Years
-67.95%
0%
-67.95%
3 Years
-66.63%
0%
-66.63%
4 Years
-37.04%
0%
-37.04%
5 Years
-30.54%
0%
-30.54%

Latest dividend: 0.16 per share ex-dividend date: Jun-21-2011

Risk Adjusted Returns v/s stock-summary
Returns Beta
Icon
Beta has not been calculated since enough price history is not available
stock-summaryNews & Corporate Actions

Announcements stock-summary

Hotel Leela Venture Limited - Other General Purpose

28-Nov-2019 | Source : NSE

Hotel Leela Venture Limited has submitted to the Exchange a copy of Disclosure of Related Party Transactions pursuant to Regulation 23(9) of the SEBI (Listing Obligations and Disclosure Requirements) Regulations, 2015 for the half year ended September 30, 2019.

Hotel Leela Venture Limited - Updates

22-Nov-2019 | Source : NSE

Hotel Leela Venture Limited has informed the Exchange regarding 'Updates'.

Hotel Leela Venture Limited - Shareholders meeting

15-Nov-2019 | Source : NSE

Hotel Leela Venture Limited has informed the Exchange regarding Notice of Postal Ballot

Corporate Actions stock-summary

stock-summary
BOARD MEETING

No Upcoming Board Meetings

stock-summary
DIVIDEND

HLV Ltd has declared 8% dividend, ex-date: 21 Jun 11

stock-summary
SPLITS

HLV Ltd has announced 2:10 stock split, ex-date: 08 Sep 06

stock-summary
BONUS

No Bonus history available

stock-summary
RIGHTS

No Rights history available

stock-summaryKey Factors

Quality key factors stock-summary

Factor
Value
Sales Growth (5y)
52.89%
EBIT Growth (5y)
14.46%
EBIT to Interest (avg)
0.81
Debt to EBITDA (avg)
2.87
Net Debt to Equity (avg)
-0.21
Sales to Capital Employed (avg)
0.30
Tax Ratio
0
Dividend Payout Ratio
0
Pledged Shares
36.49%
Institutional Holding
1.56%
ROCE (avg)
-2.62%
ROE (avg)
2.78%

Valuation key factors

Factor
Value
P/E Ratio
54
Industry P/E
36
Price to Book Value
0.89
EV to EBIT
-132.45
EV to EBITDA
18.76
EV to Capital Employed
0.87
EV to Sales
1.56
PEG Ratio
NA
Dividend Yield
NA
ROCE (Latest)
-1.38%
ROE (Latest)
1.66%

Technicals key factors

Indicator
Weekly
Monthly
MACD
Bearish
Bearish
RSI
No Signal
No Signal
Bollinger Bands
Bearish
Bearish
Moving Averages
Bearish (Daily)
KST
Bearish
Bearish
Dow Theory
Mildly Bearish
Mildly Bearish
OBV
Mildly Bearish
Mildly Bearish
stock-summary Technical Indicator Scale: Bearish, Mildly Bearish, Sideways, Mildly Bullish, Bullish  Turned 
stock-summaryShareholding
Shareholding Snapshot : Jun 2026stock-summary
Shareholding Compare (%holding) stock-summary
Majority shareholders

Non Institution

Pledged Promoter Holdings

36.4906

Mutual Funds

Held by 1 Schemes (0.0%)

FIIs

Held by 5 FIIs (0.03%)

Promoter with highest holding

Universal Hotels & Resorts Private Limited (36.47%)

Highest Public shareholder

Jm Financial Asset Reconstruction Company Limited (24.87%)

Individual Investors Holdings

22.45%

stock-summaryFinancial
[
  {
    "link": "quarterly",
    "btn_text": "All Quarterly Results",
    "header": "Quarterly Results Snapshot (Standalone) - Jun'26 - YoY",
    "rhs": [
      {
        "prefix": "Net Sales ",
        "suffix": "YoY Growth in quarter ended Jun 2026 is 14.58% vs -5.15% in Jun 2025",
        "dir": 1
      },
      {
        "prefix": "Standalone Net Profit ",
        "suffix": "YoY Growth in quarter ended Jun 2026 is 77.52% vs -314.20% in Jun 2025",
        "dir": 1
      }
    ],
    "table": {
      "header": [
        "Jun'26",
        "Jun'25",
        "Change(%)"
      ],
      "body": [
        {
          "field": "Net Sales",
          "val1": "46.68",
          "val2": "40.74",
          "chgp": "14.58%",
          "chgp_class": "positive"
        },
        {
          "field": "Operating Profit (PBDIT) excl Other Income",
          "val1": "1.16",
          "val2": "-1.71",
          "chgp": "167.84%",
          "chgp_class": "positive"
        },
        {
          "field": "Interest",
          "val1": "0.64",
          "val2": "0.61",
          "chgp": "4.92%",
          "chgp_class": "negative"
        },
        {
          "field": "Exceptional Items",
          "val1": "0.00",
          "val2": "0.00",
          "chgp": "",
          "chgp_class": "neutral"
        },
        {
          "field": "Standalone Net Profit",
          "val1": "-0.78",
          "val2": "-3.47",
          "chgp": "77.52%",
          "chgp_class": "positive"
        },
        {
          "field": "Operating Profit Margin (Excl OI)",
          "val1": "2.49%",
          "val2": "-4.20%",
          "chgp": "6.69%",
          "chgp_class": "positive"
        }
      ]
    }
  },
  {
    "link": "half-yearly",
    "btn_text": "All Half Yearly Results",
    "header": "Half Yearly Results Snapshot (Standalone) - Sep'25",
    "rhs": [
      {
        "prefix": "Net Sales ",
        "suffix": " Growth in half year ended Sep 2025 is -11.30% vs 2.77% in Sep 2024",
        "dir": -1
      },
      {
        "prefix": "Standalone Net Profit ",
        "suffix": " Growth in half year ended Sep 2025 is -362.04% vs 30.36% in Sep 2024",
        "dir": -1
      }
    ],
    "table": {
      "header": [
        "Sep'25",
        "Sep'24",
        "Change(%)"
      ],
      "body": [
        {
          "field": "Net Sales",
          "val1": "76.57",
          "val2": "86.32",
          "chgp": "-11.30%",
          "chgp_class": "negative"
        },
        {
          "field": "Operating Profit (PBDIT) excl Other Income",
          "val1": "-7.92",
          "val2": "3.38",
          "chgp": "-334.32%",
          "chgp_class": "negative"
        },
        {
          "field": "Interest",
          "val1": "1.44",
          "val2": "1.06",
          "chgp": "35.85%",
          "chgp_class": "negative"
        },
        {
          "field": "Exceptional Items",
          "val1": "-1.12",
          "val2": "2.31",
          "chgp": "-148.48%",
          "chgp_class": "negative"
        },
        {
          "field": "Standalone Net Profit",
          "val1": "-13.39",
          "val2": "5.11",
          "chgp": "-362.04%",
          "chgp_class": "negative"
        },
        {
          "field": "Operating Profit Margin (Excl OI)",
          "val1": "-10.34%",
          "val2": "3.92%",
          "chgp": "-14.26%",
          "chgp_class": "negative"
        }
      ]
    }
  },
  {
    "link": "nine-monthly",
    "btn_text": "All Nine Monthly Results",
    "header": "Nine Monthly Results Snapshot (Standalone) - Dec'25",
    "rhs": [
      {
        "prefix": "Net Sales ",
        "suffix": "YoY Growth in nine months ended Dec 2025 is -4.57% vs 3.37% in Dec 2024",
        "dir": -1
      },
      {
        "prefix": "Standalone Net Profit ",
        "suffix": "YoY Growth in nine months ended Dec 2025 is -142.39% vs 14.35% in Dec 2024",
        "dir": -1
      }
    ],
    "table": {
      "header": [
        "Dec'25",
        "Dec'24",
        "Change(%)"
      ],
      "body": [
        {
          "field": "Net Sales",
          "val1": "137.47",
          "val2": "144.05",
          "chgp": "-4.57%",
          "chgp_class": "negative"
        },
        {
          "field": "Operating Profit (PBDIT) excl Other Income",
          "val1": "3.64",
          "val2": "15.21",
          "chgp": "-76.07%",
          "chgp_class": "negative"
        },
        {
          "field": "Interest",
          "val1": "2.15",
          "val2": "1.65",
          "chgp": "30.30%",
          "chgp_class": "negative"
        },
        {
          "field": "Exceptional Items",
          "val1": "-3.03",
          "val2": "2.31",
          "chgp": "-231.17%",
          "chgp_class": "negative"
        },
        {
          "field": "Standalone Net Profit",
          "val1": "-6.52",
          "val2": "15.38",
          "chgp": "-142.39%",
          "chgp_class": "negative"
        },
        {
          "field": "Operating Profit Margin (Excl OI)",
          "val1": "2.65%",
          "val2": "10.56%",
          "chgp": "-7.91%",
          "chgp_class": "negative"
        }
      ]
    }
  },
  {
    "link": "annual",
    "btn_text": "All Annual Results",
    "header": "Annual Results Snapshot (Standalone) - Mar'26",
    "rhs": [
      {
        "prefix": "Net Sales ",
        "suffix": "YoY Growth in year ended Mar 2026 is -1.18% vs 2.11% in Mar 2025",
        "dir": -1
      },
      {
        "prefix": "Standalone Net Profit ",
        "suffix": "YoY Growth in year ended Mar 2026 is -92.04% vs 9.79% in Mar 2025",
        "dir": -1
      }
    ],
    "table": {
      "header": [
        "Mar'26",
        "Mar'25",
        "Change(%)"
      ],
      "body": [
        {
          "field": "Net Sales",
          "val1": "200.92",
          "val2": "203.31",
          "chgp": "-1.18%",
          "chgp_class": "negative"
        },
        {
          "field": "Operating Profit (PBDIT) excl Other Income",
          "val1": "14.29",
          "val2": "28.09",
          "chgp": "-49.13%",
          "chgp_class": "negative"
        },
        {
          "field": "Interest",
          "val1": "3.13",
          "val2": "2.23",
          "chgp": "40.36%",
          "chgp_class": "negative"
        },
        {
          "field": "Exceptional Items",
          "val1": "-3.03",
          "val2": "0.82",
          "chgp": "-469.51%",
          "chgp_class": "negative"
        },
        {
          "field": "Standalone Net Profit",
          "val1": "2.08",
          "val2": "26.13",
          "chgp": "-92.04%",
          "chgp_class": "negative"
        },
        {
          "field": "Operating Profit Margin (Excl OI)",
          "val1": "7.11%",
          "val2": "13.82%",
          "chgp": "-6.71%",
          "chgp_class": "negative"
        }
      ]
    }
  }
]

Quarterly Results Snapshot (Standalone) - Jun'26 - YoYstock-summary

Jun'26
Jun'25
Change(%)
Net Sales
46.68
40.74
14.58%
Operating Profit (PBDIT) excl Other Income
1.16
-1.71
167.84%
Interest
0.64
0.61
4.92%
Exceptional Items
0.00
0.00
Standalone Net Profit
-0.78
-3.47
77.52%
Operating Profit Margin (Excl OI)
2.49%
-4.20%
6.69%
Values in Rs Cr.
Direction Arrows
Net Sales

YoY Growth in quarter ended Jun 2026 is 14.58% vs -5.15% in Jun 2025

Direction Arrows
Standalone Net Profit

YoY Growth in quarter ended Jun 2026 is 77.52% vs -314.20% in Jun 2025

Half Yearly Results Snapshot (Standalone) - Sep'25stock-summary

Sep'25
Sep'24
Change(%)
Net Sales
76.57
86.32
-11.30%
Operating Profit (PBDIT) excl Other Income
-7.92
3.38
-334.32%
Interest
1.44
1.06
35.85%
Exceptional Items
-1.12
2.31
-148.48%
Standalone Net Profit
-13.39
5.11
-362.04%
Operating Profit Margin (Excl OI)
-10.34%
3.92%
-14.26%
Values in Rs Cr.
Direction Arrows
Net Sales

Growth in half year ended Sep 2025 is -11.30% vs 2.77% in Sep 2024

Direction Arrows
Standalone Net Profit

Growth in half year ended Sep 2025 is -362.04% vs 30.36% in Sep 2024

Nine Monthly Results Snapshot (Standalone) - Dec'25stock-summary

Dec'25
Dec'24
Change(%)
Net Sales
137.47
144.05
-4.57%
Operating Profit (PBDIT) excl Other Income
3.64
15.21
-76.07%
Interest
2.15
1.65
30.30%
Exceptional Items
-3.03
2.31
-231.17%
Standalone Net Profit
-6.52
15.38
-142.39%
Operating Profit Margin (Excl OI)
2.65%
10.56%
-7.91%
Values in Rs Cr.
Direction Arrows
Net Sales

YoY Growth in nine months ended Dec 2025 is -4.57% vs 3.37% in Dec 2024

Direction Arrows
Standalone Net Profit

YoY Growth in nine months ended Dec 2025 is -142.39% vs 14.35% in Dec 2024

Annual Results Snapshot (Standalone) - Mar'26stock-summary

Mar'26
Mar'25
Change(%)
Net Sales
200.92
203.31
-1.18%
Operating Profit (PBDIT) excl Other Income
14.29
28.09
-49.13%
Interest
3.13
2.23
40.36%
Exceptional Items
-3.03
0.82
-469.51%
Standalone Net Profit
2.08
26.13
-92.04%
Operating Profit Margin (Excl OI)
7.11%
13.82%
-6.71%
Values in Rs Cr.
Direction Arrows
Net Sales

YoY Growth in year ended Mar 2026 is -1.18% vs 2.11% in Mar 2025

Direction Arrows
Standalone Net Profit

YoY Growth in year ended Mar 2026 is -92.04% vs 9.79% in Mar 2025

stock-summaryCompany CV
About HLV Ltd stock-summary
stock-summary
HLV Ltd
Micro Cap
Hotels & Resorts
HLV Limited, formerly known Hotel Leela Venture Ltd, incorporated in March, 1981 is one of the leading players in the Indian hospitality industry. The Company's name was changed to HLV Limited from Hotel Leela Venture Limited on 22 October, 2019. At present, Company is engaged in owning, operating & managing hotels, palaces and resorts. It operates in both, the leisure and business sectors. The Leela palaces and resorts include a chain of five star luxury hotels and resorts.
Company Coordinates stock-summary
Company Details
The Leela, Sahar Mumbai Maharashtra : 400059
stock-summary
Tel: 91-22-66911182/83
stock-summary
investor.service@hlvltd.com
Registrar Details
Karvy Computershare Pvt Ltd., Karvy Selenium, Tower-B Plot No 31 & 32, Survey No 116/22, 115/24, 115/25, Financial District, Nanakramguda, Serilingampally, Mandal Ranga Reddy Dist, Hyderabad