
Compare HMT with Similar Stocks
Dashboard
With a Negative Book Value, the company has a Weak Long Term Fundamental Strength
- Poor long term growth as Net Sales has grown by an annual rate of -10.17% and Operating profit at 0% over the last 5 years
- The company has a negative book value of Rs 1,966.34 crore
The company has declared Negative results for the last 4 consecutive quarters
Risky - Negative EBITDA
Despite the size of the company, domestic mutual funds hold only 0.02% of the company
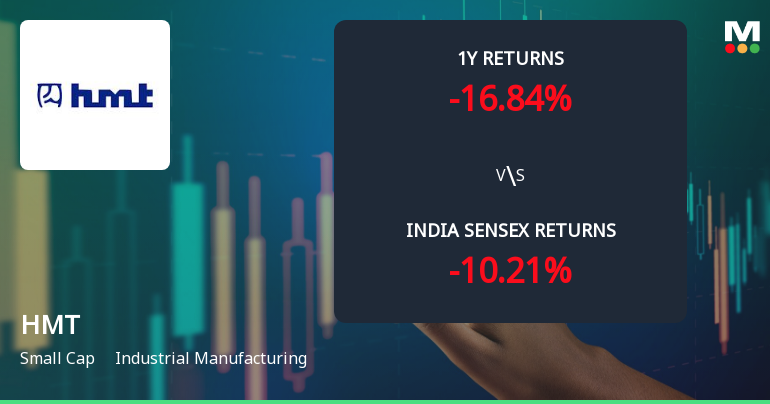
Underperformed the market in the last 1 year
Stock DNA
Industrial Manufacturing
INR 1,961 Cr (Small Cap)
NA (Loss Making)
27
0.00%
-0.42
7.83%
-1.01
Total Returns (Price + Dividend) 
HMT for the last several years.
Risk Adjusted Returns v/s
Returns Beta

News
HMT Ltd Technical Momentum Shifts Amid Mixed Market Signals
HMT Ltd, a small-cap player in the industrial manufacturing sector, has exhibited a notable shift in price momentum and technical indicators, reflecting a complex market sentiment. Despite a recent 4.99% surge in its share price to ₹55.71, the stock’s technical parameters reveal a blend of mildly bearish and bullish signals, prompting a cautious outlook for investors.
Read full news article
HMT Ltd is Rated Strong Sell
HMT Ltd is rated Strong Sell by MarketsMOJO, with this rating last updated on 24 July 2025. However, the analysis and financial metrics presented here reflect the company’s current position as of 03 June 2026, providing investors with an up-to-date view of the stock’s fundamentals, returns, and overall outlook.
Read full news article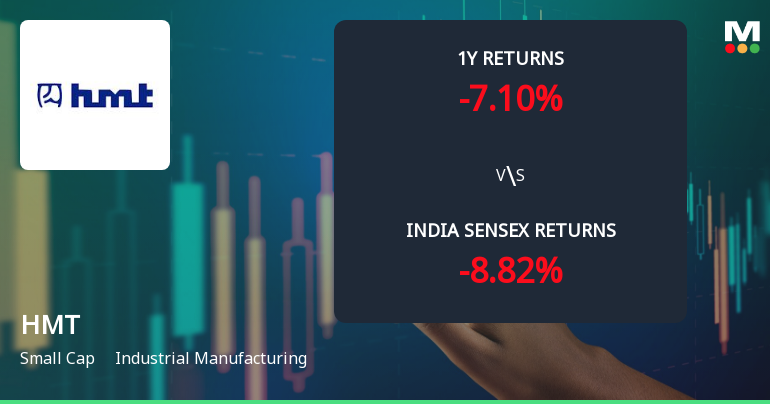
HMT Ltd Technical Momentum Shifts Amid Mixed Market Signals
HMT Ltd, a small-cap player in the industrial manufacturing sector, has experienced a notable shift in its technical momentum from mildly bullish to mildly bearish, reflecting growing caution among investors. Despite a year-to-date return of 16.47%, outperforming the Sensex’s negative 12.85%, recent technical indicators suggest a cooling off in price momentum, prompting a downgrade to a Strong Sell rating by MarketsMOJO as of 18 July 2025.
Read full news article Announcements
Compliances-Reg.24(A)-Annual Secretarial Compliance
29-May-2026 | Source : BSEAnnual Secretarial Compliance Report FY 2025-26
Announcement Under Regulation 30(LODR)-Imposition Of Fine By Stock Exchanges-31.03.2026
28-May-2026 | Source : BSEAnnouncement under Regulation 30(LODR)- Imposition of Fine by Stock Exchanges for the quarter ended 31.03.2026
Announcement under Regulation 30 (LODR)-Change in Directorate
22-May-2026 | Source : BSEExtension of additional charge of the post of Director (Finance) HMT Limited to Smt. Sameena Kohli General Manager(Finance) BHEL
Corporate Actions

No Upcoming Board Meetings

No Dividend history available

No Splits history available

No Bonus history available

No Rights history available
Quality key factors
Valuation key factors
Technicals key factors
 Technical Indicator Scale: Bearish, Mildly Bearish, Sideways, Mildly Bullish, Bullish Turned
 Shareholding Snapshot : Mar 2026
Shareholding Compare (%holding)
Promoters
None
Held by 11 Schemes (0.0%)
Held by 1 FIIs (0.0%)
Presendent Of India (56.83%)
Special National Investment Fund (5.61%)
0.62%
Quarterly Results Snapshot (Consolidated) - Dec'25 - QoQ

QoQ Growth in quarter ended Dec 2025 is -19.36% vs 5.21% in Sep 2025

QoQ Growth in quarter ended Dec 2025 is 30.30% vs -40.73% in Sep 2025
Half Yearly Results Snapshot (Consolidated) - Sep'25
Growth in half year ended Sep 2025 is -31.31% vs -10.79% in Sep 2024
Growth in half year ended Sep 2025 is -19.31% vs 4.47% in Sep 2024
Nine Monthly Results Snapshot (Consolidated) - Dec'25
YoY Growth in nine months ended Dec 2025 is -30.55% vs -10.43% in Dec 2024
YoY Growth in nine months ended Dec 2025 is 12.32% vs -18.78% in Dec 2024
Annual Results Snapshot (Consolidated) - Mar'25
YoY Growth in year ended Mar 2025 is -12.90% vs -19.83% in Mar 2024
YoY Growth in year ended Mar 2025 is -105.61% vs 2,175.48% in Mar 2024
About HMT Ltd

Company Coordinates


