
Compare Honeywell Auto with Similar Stocks
Dashboard
The company is Net-Debt Free
Poor long term growth as Net Sales has grown by an annual rate of 9.48% and Operating profit at 2.01% over the last 5 years
Flat results in Jun 26
With ROE of 12.6, it has a Very Expensive valuation with a 7.6 Price to Book Value
Majority shareholders : Promoters
Consistent Underperformance against the benchmark over the last 3 years
With its market cap of Rs 34,996 cr, it is the biggest company in the sector and constitutes 24.68% of the entire sector
Stock DNA
Industrial Manufacturing
INR 34,447 Cr (Small Cap)
60.00
54
0.28%
-0.83
12.55%
7.84
Total Returns (Price + Dividend) 
Latest dividend: 109.8839358974359 per share ex-dividend date: Jul-17-2026
Risk Adjusted Returns v/s
Returns Beta

News
Are Honeywell Automation India Ltd latest results good or bad?
Honeywell Automation India Ltd's latest financial results for Q1 FY27 reflect a mixed operational performance. The company reported net sales of ₹1,204.40 crores, which represents a year-over-year growth of 1.80%. This growth is notably lower compared to the previous year's robust growth rate of 23.19%, indicating a slowdown in revenue momentum. In terms of profitability, the net profit for the quarter stood at ₹150.70 crores, showcasing a year-over-year increase of 20.95%, contrasting with a decline in the same quarter last year. However, when compared to the previous quarter, there was a decrease of 5.63% in net profit, highlighting some volatility in earnings. Operating margins also experienced compression, with the operating margin (excluding other income) declining to 14.32%, down from 15.65% in the prior quarter. This decline in margins can be attributed to a significant rise in employee costs, whi...
Read full news article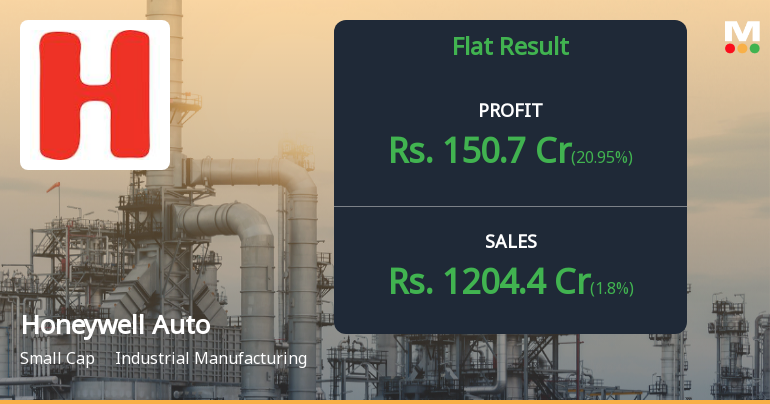
Honeywell Automation India Q1 FY27: Modest Growth Amid Margin Pressures
Honeywell Automation India Ltd., a market leader in electronics-instrumentation and process control equipment, reported a net profit of ₹150.70 crores for Q1 FY27, marking a modest sequential decline of 5.63% from the previous quarter's ₹159.70 crores. However, on a year-over-year basis, the company demonstrated resilience with profit growth of 20.90% compared to ₹124.60 crores in Q1 FY26. The stock surged 6.73% following the results announcement, closing at ₹40,034.35 and pushing the company's market capitalisation to ₹33,375 crores.
Read full news article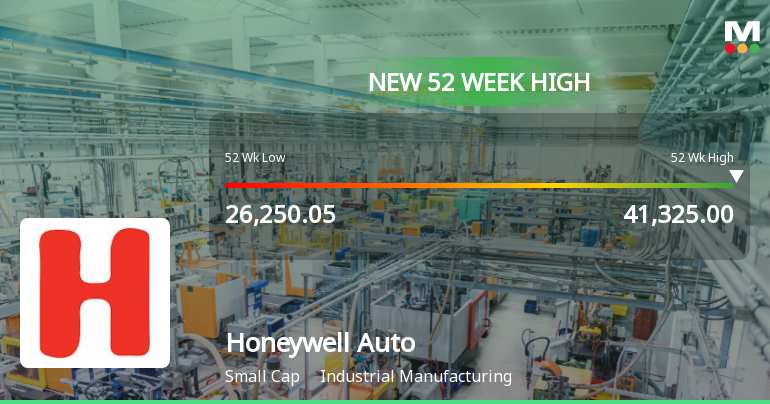
Broad-Based Technical Strength Lifts Honeywell Automation India Ltd to 52-Week High of Rs 41325
With a decisive surge to Rs 41,325 on 29 Jul 2026, Honeywell Automation India Ltd has reached a fresh 52-week high, propelled by a confluence of bullish technical indicators and sustained price momentum that outpaces its sector and the broader market.
Read full news article Announcements
Announcement under Regulation 30 (LODR)-Newspaper Publication
30-Jul-2026 | Source : BSENewspaper publication for unaudited financial results of Honeywell Automation India Limited for quarter ended June 30 2026
Board Meeting Outcome for Results For The First Quarter Ended June 30 2026
29-Jul-2026 | Source : BSEThe Board at its meeting held today approved the unaudited financials results for the quarter ended June 30 2026 along with Limited review report from the statutory auditors.
Results For The First Quarter Ended June 30 2026.
29-Jul-2026 | Source : BSEThe Board at its meeting held today approved the unaudited Financial results for quarter ended June 30 2026 along with the limited review report from the Statutory Auditors.
Corporate Actions

No Upcoming Board Meetings

Honeywell Automation India Ltd has declared 1100% dividend, ex-date: 17 Jul 26

No Splits history available

No Bonus history available

No Rights history available
Quality key factors
Valuation key factors
Technicals key factors
 Technical Indicator Scale: Bearish, Mildly Bearish, Sideways, Mildly Bullish, Bullish Turned
 Shareholding Snapshot : Jun 2026
Shareholding Compare (%holding)
Promoters
None
Held by 25 Schemes (10.05%)
Held by 130 FIIs (3.95%)
Hail Mauritius Limited (75.0%)
Sbi Small Cap Fund (6.1%)
8.05%
Quarterly Results Snapshot (Standalone) - Jun'26 - YoY

YoY Growth in quarter ended Jun 2026 is 1.80% vs 23.19% in Jun 2025

YoY Growth in quarter ended Jun 2026 is 20.95% vs -8.72% in Jun 2025
Half Yearly Results Snapshot (Standalone) - Sep'25
Growth in half year ended Sep 2025 is 17.55% vs -2.56% in Sep 2024
Growth in half year ended Sep 2025 is -2.98% vs 11.67% in Sep 2024
Nine Monthly Results Snapshot (Standalone) - Dec'25
YoY Growth in nine months ended Dec 2025 is 13.86% vs -1.04% in Dec 2024
YoY Growth in nine months ended Dec 2025 is -4.80% vs 8.64% in Dec 2024
Annual Results Snapshot (Standalone) - Mar'26
YoY Growth in year ended Mar 2026 is 11.75% vs 3.24% in Mar 2025
YoY Growth in year ended Mar 2026 is 0.27% vs 4.43% in Mar 2025
About Honeywell Automation India Ltd

Company Coordinates


