
Compare Horiba Ltd. with Similar Stocks
Dashboard
Strong Long Term Fundamental Strength with an average Return on Equity (ROE) of 12.06%
- Healthy long term growth as Net Sales has grown by an annual rate of 9.80%
- Company's ability to service its debt is strong with a healthy EBIT to Interest (avg) ratio of 55.93
With ROE of 11.62%, it has a very attractive valuation with a 1.50 Price to Book Value
Market Beating performance in long term as well as near term
Stock DNA
Industrial Manufacturing
JPY 498,141 Million (Mid Cap)
13.00
NA
0.02%
-0.28
11.84%
1.59
Total Returns (Price + Dividend) 
Horiba Ltd. for the last several years.
Risk Adjusted Returns v/s
News
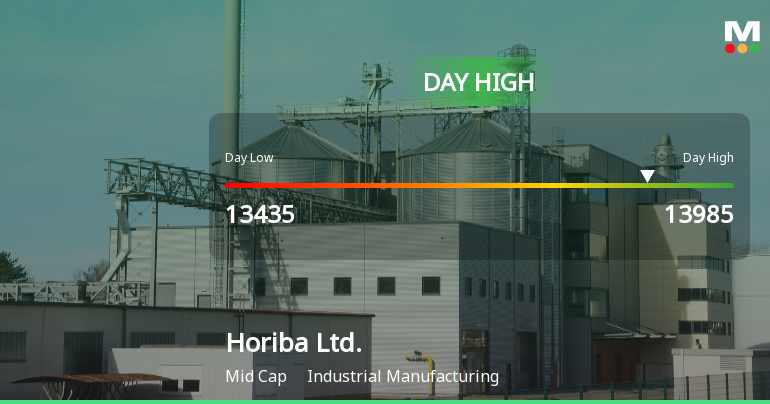
Horiba Ltd. Hits Day High with 6.11% Surge in Stock Price
Horiba Ltd. has experienced notable stock performance, with significant gains over various timeframes, including a robust yearly increase. The company showcases strong financial health, marked by solid return on equity and impressive sales growth, reinforcing its competitive position in the industrial manufacturing sector.
Read full news article Announcements

Corporate Actions
Quality key factors
Valuation key factors
Technicals key factors
 Technical Indicator Scale: Bearish, Mildly Bearish, Sideways, Mildly Bullish, Bullish Turned
 Shareholding Snapshot : Mar 2024
Shareholding Compare (%holding)
Foreign Institutions
Held in 0 Schemes (0%)
Held by 1 Foreign Institutions (0.0%)
Quarterly Results Snapshot (Consolidated) - Jun'25 - YoY

YoY Growth in quarter ended Jun 2025 is 6.34% vs 11.06% in Jun 2024

YoY Growth in quarter ended Jun 2025 is 26.63% vs 12.30% in Jun 2024
Annual Results Snapshot (Consolidated) - Dec'24
YoY Growth in year ended Dec 2024 is 9.23% vs 7.56% in Dec 2023
YoY Growth in year ended Dec 2024 is -16.63% vs 18.28% in Dec 2023
About Horiba Ltd.

Company Coordinates


