
Compare Hour Loop, Inc. with Similar Stocks
Total Returns (Price + Dividend) 
TimePeriod
Price Return
Dividend Return
Total Return
3 Months
2.27%
0%
2.27%
6 Months
23.29%
0%
23.29%
1 Year
78.22%
0%
78.22%
2 Years
8.43%
0%
8.43%
3 Years
-40.4%
0%
-40.4%
4 Years
0%
0%
0.0%
5 Years
0%
0%
0.0%
Hour Loop, Inc. for the last several years.
Risk Adjusted Returns v/s
News
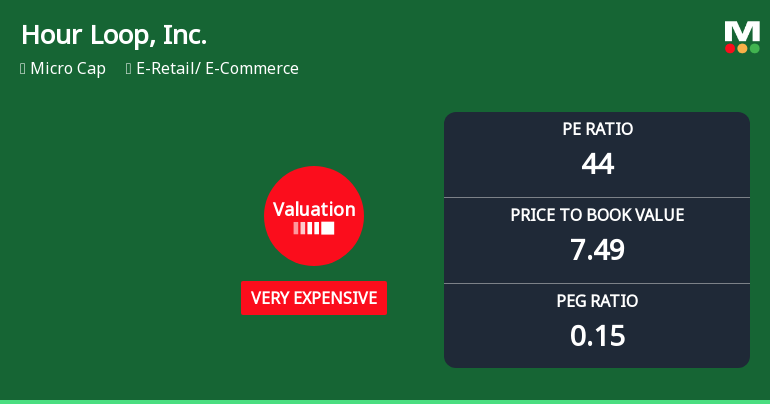
Hour Loop, Inc. Experiences Valuation Adjustment Amidst E-Retail Sector Dynamics
Hour Loop, Inc., a microcap in the E-Retail/E-Commerce sector, has adjusted its valuation, showcasing a P/E ratio of 44 and a price-to-book value of 7.49. Its performance metrics contrast sharply with peers, revealing notable year-over-year returns despite a decline year-to-date, highlighting industry complexities.
Read full news article Announcements

No announcement available
Corporate Actions
No corporate action available
Quality key factors
Factor
Value
Sales Growth (5y)
26.14%
EBIT Growth (5y)
-30.66%
EBIT to Interest (avg)
0.33
Debt to EBITDA (avg)
2.78
Net Debt to Equity (avg)
0.77
Sales to Capital Employed (avg)
10.61
Tax Ratio
14.64%
Dividend Payout Ratio
0
Pledged Shares
0
Institutional Holding
0.52%
ROCE (avg)
22.18%
ROE (avg)
11.76%
Valuation key factors
Factor
Value
P/E Ratio
44
Industry P/E
Price to Book Value
7.49
EV to EBIT
48.04
EV to EBITDA
48.04
EV to Capital Employed
4.67
EV to Sales
0.34
PEG Ratio
0.15
Dividend Yield
NA
ROCE (Latest)
1.11%
ROE (Latest)
4.23%
Technicals key factors
Indicator
Weekly
Monthly
MACD
Bearish
Bullish
RSI
No Signal
No Signal
Bollinger Bands
Bearish
Mildly Bullish
Moving Averages
Mildly Bullish (Daily)
KST
Bearish
Bullish
Dow Theory
No Trend
No Trend
OBV
Mildly Bearish
Mildly Bearish
 Technical Indicator Scale: Bearish, Mildly Bearish, Sideways, Mildly Bullish, Bullish Turned
 Shareholding Snapshot : Sep 2025
Shareholding Compare (%holding)
Majority shareholders
Domestic Funds
Domestic Funds
Held in 2 Schemes (0.06%)
Foreign Institutions
Held by 2 Foreign Institutions (0.04%)
Strategic Entities with highest holding
Highest Public shareholder
Quarterly Results Snapshot (Consolidated) - Jun'25 - YoY
Jun'25
Jun'24
Change(%)
Net Sales
27.10
28.10
-3.56%
Operating Profit (PBDIT) excl Other Income
1.70
1.00
70.00%
Interest
0.00
0.10
-100.00%
Exceptional Items
0.00
0.00
Consolidate Net Profit
1.20
0.60
100.00%
Operating Profit Margin (Excl OI)
59.80%
33.40%
2.64%
USD in Million.

Net Sales
YoY Growth in quarter ended Jun 2025 is -3.56% vs 25.45% in Jun 2024
Consolidated Net Profit
YoY Growth in quarter ended Jun 2025 is 100.00% vs 175.00% in Jun 2024
Annual Results Snapshot (Consolidated) - Dec'24
Dec'24
Dec'23
Change(%)
Net Sales
138.30
132.10
4.69%
Operating Profit (PBDIT) excl Other Income
1.10
-2.50
144.00%
Interest
0.20
0.20
Exceptional Items
0.00
0.00
Consolidate Net Profit
0.70
-2.40
129.17%
Operating Profit Margin (Excl OI)
5.30%
-22.70%
2.80%
USD in Million.
Net Sales
YoY Growth in year ended Dec 2024 is 4.69% vs 37.75% in Dec 2023

Consolidated Net Profit
YoY Growth in year ended Dec 2024 is 129.17% vs -60.00% in Dec 2023
About Hour Loop, Inc.

Hour Loop, Inc.
E-Retail/ E-Commerce
No Details Available.
Company Coordinates
No Company Details Available
InfinHub Market Technologies FZ-LLC, Building-2, Unit 112, Dubai Internet City, Dubai, United Arab Emirates
GET THE MARKETSMOJO APP


Company
Stocks
Portfolio


"Investment in securities markets are subject to market risk. Read all the related documents carefully before investing."