
Compare HPL Electric with Similar Stocks
Stock DNA
Other Electrical Equipment
INR 2,236 Cr (Small Cap)
24.00
56
0.29%
0.67
9.51%
2.25
Total Returns (Price + Dividend) 
Latest dividend: 1 per share ex-dividend date: Sep-22-2025
Risk Adjusted Returns v/s
Returns Beta

News
HPL Electric & Power Ltd is Rated Sell
HPL Electric & Power Ltd is rated 'Sell' by MarketsMOJO, with this rating last updated on 13 May 2026. However, the analysis and financial metrics presented here reflect the stock's current position as of 08 June 2026, providing investors with an up-to-date view of the company’s fundamentals, returns, and market performance.
Read full news article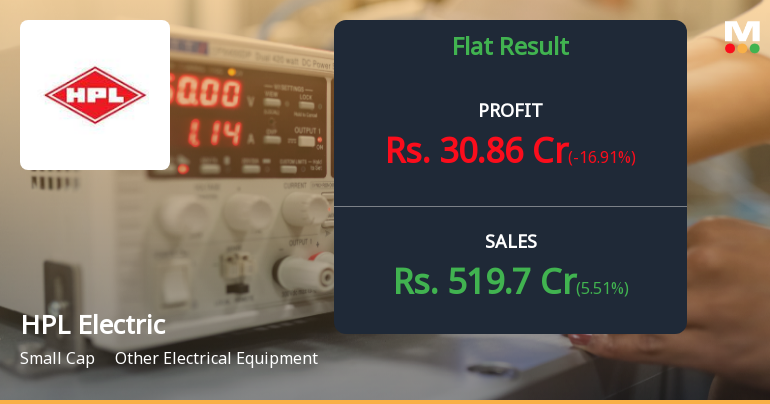
HPL Electric Q4 FY26: Strong Quarter Masks Deeper Valuation Concerns
HPL Electric & Power Ltd., a small-cap player in India's electrical equipment sector with a market capitalisation of ₹2,260.00 crores, delivered a robust operational performance in the March 2026 quarter (Q4 FY26), posting a consolidated net profit of ₹30.86 crores. This represented a striking sequential improvement of 58.66% quarter-on-quarter, though it marked a 16.91% decline year-on-year from the ₹37.14 crores recorded in Q4 FY25. Despite the strong quarterly showing, the stock has faced sustained pressure, declining 39.58% over the past year and trading at ₹344.25 as of June 08, 2026—a precipitous 46.17% below its 52-week high of ₹639.50.
Read full news article
HPL Electric & Power Ltd is Rated Sell
HPL Electric & Power Ltd is rated 'Sell' by MarketsMOJO, with this rating last updated on 13 May 2026. However, the analysis and financial metrics discussed here reflect the stock's current position as of 08 June 2026, providing investors with an up-to-date view of the company’s fundamentals, valuation, financial trends, and technical outlook.
Read full news article Announcements
Announcement under Regulation 30 (LODR)-Newspaper Publication
06-Jun-2026 | Source : BSENewspaper Publications
Shareholder Meeting / Postal Ballot-Notice of Postal Ballot
05-Jun-2026 | Source : BSENotice of Postal Ballot.
Compliances-Reg.24(A)-Annual Secretarial Compliance
29-May-2026 | Source : BSEAnnual Secretarial Compliance Report for the year ended March 31 2026
Corporate Actions

No Upcoming Board Meetings

HPL Electric & Power Ltd has declared 10% dividend, ex-date: 22 Sep 25

No Splits history available

No Bonus history available

No Rights history available
Quality key factors
Valuation key factors
Technicals key factors
 Technical Indicator Scale: Bearish, Mildly Bearish, Sideways, Mildly Bullish, Bullish Turned
 Shareholding Snapshot : Mar 2026
Shareholding Compare (%holding)
Promoters
2.4187
Held by 0 Schemes
Held by 32 FIIs (0.51%)
Hpl India Limited (27.33%)
None
23.25%
Quarterly Results Snapshot (Consolidated) - Mar'26 - YoY

YoY Growth in quarter ended Mar 2026 is 5.51% vs 16.14% in Mar 2025
YoY Growth in quarter ended Mar 2026 is -16.91% vs 170.90% in Mar 2025
Half Yearly Results Snapshot (Consolidated) - Sep'25
Growth in half year ended Sep 2025 is 0.28% vs 21.46% in Sep 2024
Growth in half year ended Sep 2025 is 5.58% vs 115.12% in Sep 2024
Nine Monthly Results Snapshot (Consolidated) - Dec'25
YoY Growth in nine months ended Dec 2025 is 6.93% vs 16.49% in Dec 2024
YoY Growth in nine months ended Dec 2025 is 6.22% vs 89.65% in Dec 2024
Annual Results Snapshot (Consolidated) - Mar'26
YoY Growth in year ended Mar 2026 is 6.52% vs 16.39% in Mar 2025
YoY Growth in year ended Mar 2026 is -2.94% vs 115.27% in Mar 2025
About HPL Electric & Power Ltd

Company Coordinates


