
Compare Huntington Ingalls Industries, Inc. with Similar Stocks
Dashboard
The company has declared Negative results for the last 3 consecutive quarters
- NET PROFIT(9M) At USD 424 MM has Grown at -29.33%
- ROCE(HY) Lowest at 11.59%
- RAW MATERIAL COST(Y) Grown by 12.51% (YoY)
With ROCE of 6.17%, it has a fair valuation with a 1.91 Enterprise value to Capital Employed
Market Beating Performance
Total Returns (Price + Dividend) 
Huntington Ingalls Industries, Inc. for the last several years.
Risk Adjusted Returns v/s
News
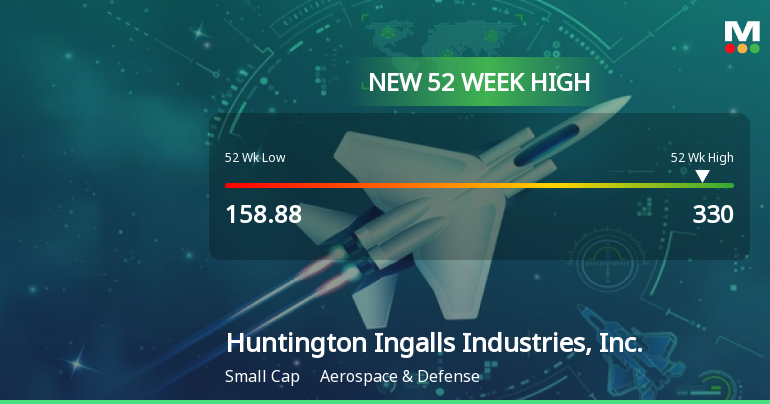
Huntington Ingalls Industries Hits New 52-Week High at $330.00
Huntington Ingalls Industries, Inc. achieved a new 52-week high, reflecting its strong performance in the Aerospace & Defense sector. The company has a market capitalization of USD 14,183 million, a P/E ratio of 22.00, and a healthy debt-to-equity ratio of 0.48, indicating effective management and growth.
Read full news article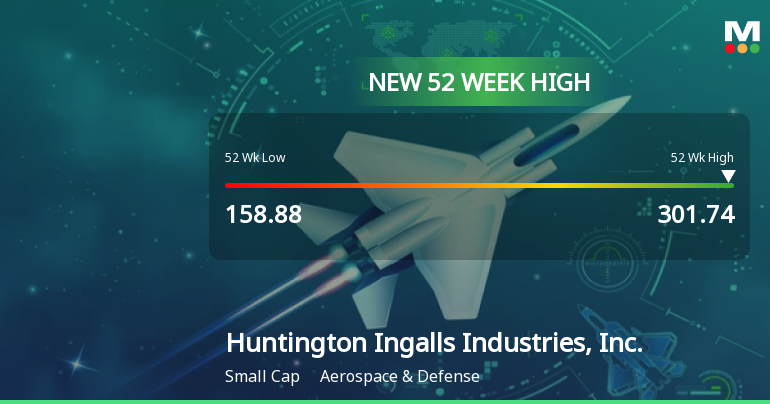
Huntington Ingalls Industries Hits New 52-Week High at $301.74
Huntington Ingalls Industries, Inc. achieved a new 52-week high, reflecting strong performance in the Aerospace & Defense sector with a one-year gain of 20.96%. The company has a market capitalization of USD 14,183 million, a P/E ratio of 22.00, and a notable dividend yield of 76.64%.
Read full news article Announcements

Corporate Actions
Quality key factors
Valuation key factors
Technicals key factors
 Technical Indicator Scale: Bearish, Mildly Bearish, Sideways, Mildly Bullish, Bullish Turned
 Shareholding Snapshot : Mar 2025
Shareholding Compare (%holding)
Domestic Funds
Held in 121 Schemes (57.39%)
Held by 273 Foreign Institutions (11.8%)
Quarterly Results Snapshot (Consolidated) - Jun'25 - YoY

YoY Growth in quarter ended Jun 2025 is 3.53% vs 6.82% in Jun 2024
YoY Growth in quarter ended Jun 2025 is -12.14% vs 33.08% in Jun 2024
Annual Results Snapshot (Consolidated) - Dec'24
YoY Growth in year ended Dec 2024 is 0.71% vs 7.29% in Dec 2023
YoY Growth in year ended Dec 2024 is -19.24% vs 17.62% in Dec 2023
About Huntington Ingalls Industries, Inc.

Company Coordinates


