
Compare I G Petrochems with Similar Stocks
Dashboard
Company has a Debt to Equity ratio (avg) of 0.03 times
Poor long term growth as Operating profit has grown by an annual rate -37.33% of over the last 5 years
Flat results in Mar 26
With ROE of 0.2, it has a Very Expensive valuation with a 1 Price to Book Value
Despite the size of the company, domestic mutual funds hold only 0% of the company
Consistent Underperformance against the benchmark over the last 3 years
Stock DNA
Commodity Chemicals
INR 1,328 Cr (Micro Cap)
591.00
47
2.33%
0.08
0.17%
0.99
Total Returns (Price + Dividend) 
Latest dividend: 10 per share ex-dividend date: Jul-31-2025
Risk Adjusted Returns v/s
Returns Beta

News
I G Petrochemicals Ltd is Rated Hold by MarketsMOJO
I G Petrochemicals Ltd is rated Hold by MarketsMOJO, with this rating last updated on 18 May 2026. However, the analysis and financial metrics discussed here reflect the stock’s current position as of 17 July 2026, providing investors with an up-to-date view of the company’s fundamentals, returns, and market standing.
Read full news article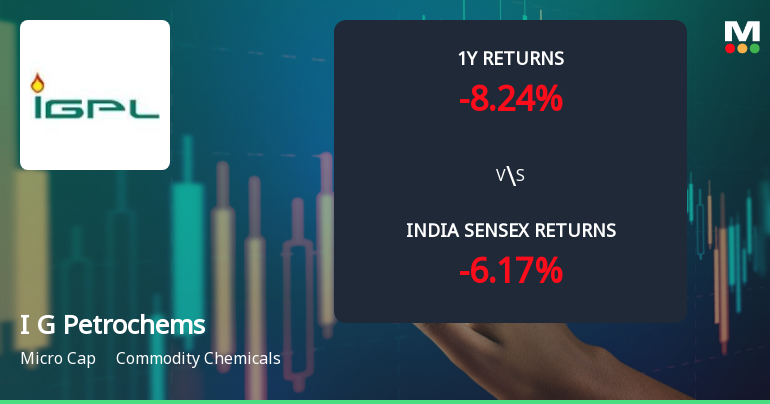
I G Petrochemicals Ltd Technical Momentum Shifts Amid Mixed Market Returns
I G Petrochemicals Ltd has experienced a nuanced shift in its technical momentum, moving from a bullish to a mildly bullish stance as of early July 2026. Despite a recent decline in daily price, the company’s technical indicators present a complex picture, reflecting mixed signals across weekly and monthly timeframes. This analysis delves into the latest technical parameters, price movements, and comparative market returns to provide a comprehensive view for investors.
Read full news article
I G Petrochemicals Ltd is Rated Hold
I G Petrochemicals Ltd is rated Hold by MarketsMOJO, with this rating last updated on 18 May 2026. However, the analysis and financial metrics discussed here reflect the stock’s current position as of 06 July 2026, providing investors with an up-to-date view of the company’s fundamentals, valuation, financial trends, and technical outlook.
Read full news article Announcements
IG Petrochemicals Limited - Updates
09-Dec-2019 | Source : NSEIG Petrochemicals Limited has informed the Exchange regarding 'Intimation regarding transfer of shares of the Company pursuant to SEBI Circular SEBI/HO/MIRSD/DOS3/CIR/2018/139 dated 6th November, 2018 on standardized norms for transfer of securities in physical mode.'.
Price movement
18-Sep-2019 | Source : NSE
| Significant movement in price has been observed in IG Petrochemicals Limited. The Exchange, in order to ensure that investors have latest relevant information about the company and to inform the market place so that the interest of the investors is safeguarded, had written to the company. IG Petrochemicals Limited has submitted their response. |
Price movement
17-Sep-2019 | Source : NSE
| Significant movement in price has been observed in IG Petrochemicals Limited. The Exchange, in order to ensure that investors have latest relevant information about the company and to inform the market place so that the interest of the investors is safeguarded, has written to the company. The response from the company is awaited. |
Corporate Actions

No Upcoming Board Meetings

I G Petrochemicals Ltd has declared 50% dividend, ex-date: 30 Jul 26

No Splits history available

No Bonus history available

No Rights history available
Quality key factors
Valuation key factors
Technicals key factors
 Technical Indicator Scale: Bearish, Mildly Bearish, Sideways, Mildly Bullish, Bullish Turned
 Shareholding Snapshot : Mar 2026
Shareholding Compare (%holding)
Promoters
None
Held by 1 Schemes (0.0%)
Held by 29 FIIs (2.92%)
Vincent India Limited (15.4%)
None
19.3%
Quarterly Results Snapshot (Consolidated) - Mar'26 - QoQ

QoQ Growth in quarter ended Mar 2026 is 12.67% vs -0.00% in Dec 2025
QoQ Growth in quarter ended Mar 2026 is 358.47% vs -443.00% in Dec 2025
Half Yearly Results Snapshot (Consolidated) - Sep'25

Growth in half year ended Sep 2025 is -19.92% vs 10.51% in Sep 2024
Growth in half year ended Sep 2025 is -124.49% vs 33.86% in Sep 2024
Nine Monthly Results Snapshot (Consolidated) - Dec'25
YoY Growth in nine months ended Dec 2025 is -18.85% vs 11.72% in Dec 2024
YoY Growth in nine months ended Dec 2025 is -128.81% vs 194.42% in Dec 2024
Annual Results Snapshot (Consolidated) - Mar'26
YoY Growth in year ended Mar 2026 is -12.75% vs 5.11% in Mar 2025
YoY Growth in year ended Mar 2026 is -97.96% vs 175.12% in Mar 2025
About I G Petrochemicals Ltd

Company Coordinates


