
Compare IDBI Bank with Similar Stocks
Total Returns (Price + Dividend) 
Latest dividend: 2.1 per share ex-dividend date: Jul-15-2025
Risk Adjusted Returns v/s
Returns Beta

News
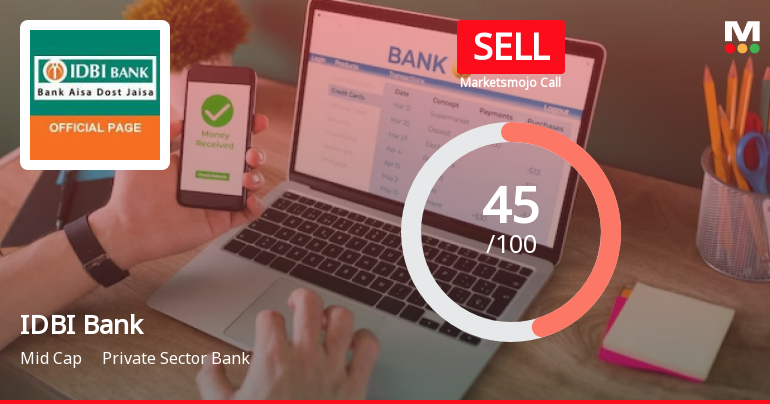
IDBI Bank Ltd. is Rated Sell by MarketsMOJO
IDBI Bank Ltd. is rated 'Sell' by MarketsMOJO, with this rating last updated on 18 July 2026. However, the analysis and financial metrics discussed here reflect the stock’s current position as of 29 July 2026, providing investors with an up-to-date view of the company’s fundamentals, valuation, financial trends, and technical outlook.
Read full news articleAre IDBI Bank Ltd. latest results good or bad?
IDBI Bank Ltd.'s latest financial results for Q1 FY2027 present a mixed picture, highlighting both strengths and challenges. The bank reported a net profit of ₹2,115.18 crores, reflecting an increase compared to the previous quarter, driven in part by negative provisions amounting to ₹636.87 crores. This reversal of provisions raises questions regarding the sustainability of profit growth, as it significantly contributed to the reported earnings. Total income for the quarter was ₹8,573.02 crores, which marked a decline from the previous quarter, although it showed a slight year-on-year improvement. The decrease in total income raises concerns about revenue momentum as the bank enters the fiscal year. Additionally, net interest margin (NIM) contracted to 3.61%, down from 4.15% in the prior quarter, indicating pressure on profitability from rising interest costs and declining interest income. On a positive ...
Read full news article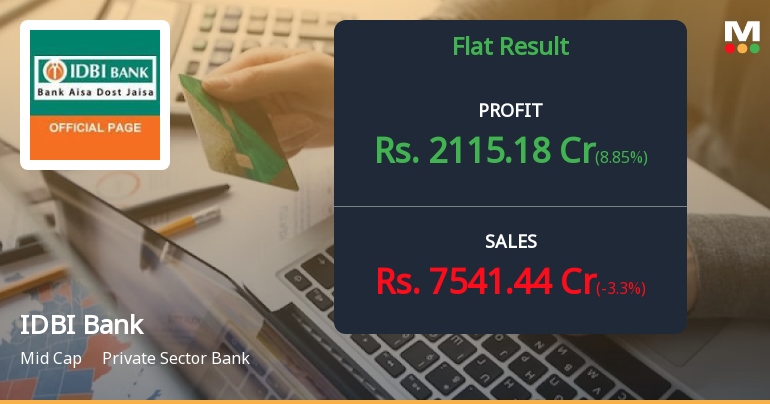
IDBI Bank Q1 FY2027: Profit Growth Masks Margin Pressure and Rising Provisioning Concerns
IDBI Bank Ltd. reported a net profit of ₹2,115.18 crores for Q1 FY2027, marking a modest 5.37% year-on-year growth from ₹2,007.36 crores in Q1 FY2026, whilst delivering an 8.85% sequential increase from ₹1,943.17 crores in Q4 FY2026. Despite the headline profit growth, the mid-cap private sector lender with a market capitalisation of ₹91,879 crores faces mounting concerns around margin compression, with net interest margins contracting sharply to 3.61% from 4.15% in the previous quarter. The stock traded at ₹87.02 on July 17, 2026, reflecting investor caution as the bank navigates a challenging operating environment characterised by elevated provisioning write-backs and declining core income momentum.
Read full news article Announcements
IDBI Bank Limited - Clarification
18-Nov-2019 | Source : NSEIDBI Bank Limited with respect to announcement dated 08-Nov-2019, regarding Appointment of Statutory Central Auditors for FY 2019-20. On basis of above the Company is required to clarify following: 1. Brief profile (in case of appointment). The response of the Company is awaited.
IDBI Bank Limited - Updates
04-Nov-2019 | Source : NSEIDBI Bank Limited has informed the Exchange regarding 'Submission of copies of newspaper advertisement in r/o date of
IDBI Bank Limited - Analysts/Institutional Investor Meet/Con. Call Updates
01-Nov-2019 | Source : NSEIDBI Bank Limited has informed the Exchange regarding Analysts/Institutional Investor Meet/Con. Call Updates
Corporate Actions

No Upcoming Board Meetings

IDBI Bank Ltd. has declared 21% dividend, ex-date: 15 Jul 25

No Splits history available

No Bonus history available

No Rights history available
Quality key factors
Valuation key factors
Technicals key factors
 Technical Indicator Scale: Bearish, Mildly Bearish, Sideways, Mildly Bullish, Bullish Turned
 Shareholding Snapshot : Jun 2026
Shareholding Compare (%holding)
Promoters
None
Held by 18 Schemes (0.07%)
Held by 66 FIIs (0.45%)
Life Insurance Corporation Of India (49.24%)
None
3.81%
Quarterly Results Snapshot (Standalone) - Jun'26 - QoQ

QoQ Growth in quarter ended Jun 2026 is -3.3% vs 10.25% in Mar 2026

QoQ Growth in quarter ended Jun 2026 is 8.85% vs 0.40% in Mar 2026
Half Yearly Results Snapshot (Standalone) - Sep'25
Growth in half year ended Sep 2025 is 0.12% vs 9.41% in Sep 2024
Growth in half year ended Sep 2025 is 58.47% vs 39.58% in Sep 2024
Nine Monthly Results Snapshot (Standalone) - Dec'25
YoY Growth in nine months ended Dec 2025 is -3.31% vs 12.8% in Dec 2024
YoY Growth in nine months ended Dec 2025 is 38.55% vs 36.41% in Dec 2024
Annual Results Snapshot (Standalone) - Mar'26
YoY Growth in year ended Mar 2026 is 0.33% vs 9.37% in Mar 2025
YoY Growth in year ended Mar 2026 is 26.59% vs 33.39% in Mar 2025
About IDBI Bank Ltd.

Company Coordinates


