
Compare IFL Enterprises with Similar Stocks
Dashboard
With a Operating Losses, the company has a Weak Long Term Fundamental Strength
- Company's ability to service its debt is weak with a poor EBIT to Interest (avg) ratio of -1.74
- The company has been able to generate a Return on Equity (avg) of 2.03% signifying low profitability per unit of shareholders funds
With a fall in Net Sales of -59.56%, the company declared Very Negative results in Mar 26
Risky - Negative EBITDA
Stock DNA
Trading & Distributors
INR 50 Cr (Micro Cap)
NA (Loss Making)
23
0.00%
0.01
-0.21%
0.41
Total Returns (Price + Dividend) 
Latest dividend: 0 per share ex-dividend date: Nov-17-2023
Risk Adjusted Returns v/s
Returns Beta

News

IFL Enterprises Ltd is Rated Strong Sell
IFL Enterprises Ltd is rated Strong Sell by MarketsMOJO, with this rating last updated on 13 February 2026. However, the analysis and financial metrics discussed here reflect the company’s current position as of 18 June 2026, providing investors with the latest insights into its performance and outlook.
Read full news article
IFL Enterprises Ltd is Rated Strong Sell
IFL Enterprises Ltd is rated Strong Sell by MarketsMOJO. This rating was last updated on 13 Feb 2026, reflecting a significant reassessment of the stock’s outlook. However, the analysis below is based on the company’s current fundamentals, returns, and financial metrics as of 04 June 2026, providing investors with the latest perspective on its performance and prospects.
Read full news article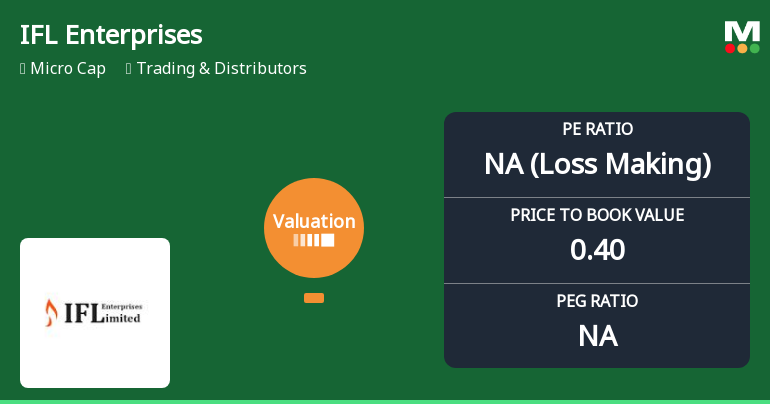
IFL Enterprises Ltd Faces Valuation Reassessment Amid Deteriorating Fundamentals
IFL Enterprises Ltd, a micro-cap player in the Trading & Distributors sector, has seen a marked deterioration in its valuation parameters, signalling heightened risk for investors. The company’s price-to-earnings (P/E) ratio has plunged into negative territory, while price-to-book value (P/BV) remains low but no longer attractive, reflecting a shift from previously favourable valuation to a risky profile amid sustained share price declines and weak financial metrics.
Read full news article Announcements
Board Meeting Outcome for Outcome Of The Meeting Of The Board Of Directors Of IFL Enterprises Limited Held On Today I.E. Wednesday 17Th June 2026
17-Jun-2026 | Source : BSEOutcome of the Meeting of the Board of Directors of IFL Enterprises Limited held on Today i.e. Wednesday 17th June 2026
Announcement under Regulation 30 (LODR)-Resignation of Company Secretary / Compliance Officer
17-Jun-2026 | Source : BSEResignation of Company Secretary and Compliance Officer
Compliances-Reg.24(A)-Annual Secretarial Compliance
30-May-2026 | Source : BSESubmission of Annual Secretarial Compliance Report for the year ended 31st March 2026 under Regulation 24A of SEBI (LODR) Regulations 2015.
Corporate Actions

No Upcoming Board Meetings


IFL Enterprises Ltd has announced 1:10 stock split, ex-date: 21 Apr 23

IFL Enterprises Ltd has announced 1:150 bonus issue, ex-date: 20 Sep 24

IFL Enterprises Ltd has announced 60:91 rights issue, ex-date: 13 Jun 25
Quality key factors
Valuation key factors
Technicals key factors
 Technical Indicator Scale: Bearish, Mildly Bearish, Sideways, Mildly Bullish, Bullish Turned
 Shareholding Snapshot : Mar 2026
Shareholding Compare (%holding)
Non Institution
None
Held by 0 Schemes
Held by 0 FIIs
None
Amit Kumar Agarwal (1.06%)
97.34%
Quarterly Results Snapshot (Consolidated) - Mar'26 - YoY

YoY Growth in quarter ended Mar 2026 is -59.56% vs 3,524.62% in Mar 2025
YoY Growth in quarter ended Mar 2026 is -404.28% vs 547.06% in Mar 2025
Half Yearly Results Snapshot (Consolidated) - Sep'25
Growth in half year ended Sep 2025 is 130.76% vs 331.59% in Sep 2024

Growth in half year ended Sep 2025 is 4,335.71% vs -121.54% in Sep 2024
Nine Monthly Results Snapshot (Consolidated) - Dec'25
YoY Growth in nine months ended Dec 2025 is -13.51% vs 674.44% in Dec 2024
YoY Growth in nine months ended Dec 2025 is 1,966.67% vs -82.35% in Dec 2024
Annual Results Snapshot (Consolidated) - Mar'26
YoY Growth in year ended Mar 2026 is -41.05% vs 1,363.71% in Mar 2025
YoY Growth in year ended Mar 2026 is -223.08% vs 251.76% in Mar 2025
About IFL Enterprises Ltd

Company Coordinates


