Igarashi Motors

  • Market Cap: Micro Cap
  • Industry: Auto Components & Equipments
  • ISIN: INE188B01013
  • NSEID: IGARASHI
  • BSEID: 517380
INR
414.30
19.8 (5.02%)
BSENSE

Jun 19, 03:30 PM

BSE+NSE Vol: 5.23 lacs

  • Price Points
  • Score
  • Mojo Parameters
  • Total Return
  • News and Corporate Actions
  • Key factors
  • Shareholding
  • Financials
  • CompanyCV
stock-summaryPrice Point
High/Low

1Day

52 Week

Valuation
Technical
Day's Volume

CASH

5.23 lacs (-75.82%) Volume

Shareholding (Mar 2026)

FII

0.13%

Held by 6 FIIs

DII

2.12%

Held by 1 DIIs

Promoter

75.00%

Why is Igarashi Motors India Ltd falling/rising?

20-Jun-2026

As of 20-Jun, Igarashi Motors India Ltd's stock price is rising to 412.75, up 4.43%, driven by strong performance against the Sensex and increased investor participation. The stock shows positive short-term momentum despite being below its 200-day moving average.

As of 20-Jun, Igarashi Motors India Ltd's stock price is rising, currently at 412.75, reflecting an increase of 17.5 or 4.43%. This upward movement is supported by several factors. Over the past week, the stock has outperformed the benchmark Sensex, gaining 9.25% compared to the Sensex's 1.69%. Additionally, today's performance indicates that the stock has outperformed its sector by 5.06%. <BR><BR>The stock reached an intraday high of Rs 418.35, marking a rise of 5.84% during the trading day. Furthermore, there has been a notable increase in investor participation, with a delivery volume of 1.82 lacs on June 18, which is up by 41.32% against the 5-day average delivery volume. <BR><BR>While the stock is currently trading above its 5-day, 20-day, 50-day, and 100-day moving averages, it remains below the 200-day moving average, indicating a mixed long-term trend. However, the current liquidity is sufficient for trading, with the stock being liquid enough for a trade size of Rs 1.78 crore based on 2% of the 5-day average traded value. Overall, these factors contribute to the positive momentum in Igarashi Motors India Ltd's stock price.

View full answer

How big is Igarashi Motors?

11-Jun-2026

As of 10th June, Igarashi Motors India Ltd has a market capitalization of 1,176.00 Cr, with recent Net Sales of 865.91 Cr and a Net Profit of 12.14 Cr. The company reported Shareholder's Funds of 465.55 Cr and Total Assets of 775.01 Cr for the latest annual period ending March 2025.

As of 10th June, Igarashi Motors India Ltd has a market capitalization of 1,176.00 Cr, categorizing it as a Micro Cap company.<BR><BR>In the latest four quarters, Igarashi Motors reported Net Sales of 865.91 Cr and a Net Profit of 12.14 Cr.<BR><BR>For the latest annual period ending March 2025, the company had Shareholder's Funds of 465.55 Cr and Total Assets amounting to 775.01 Cr.

View full answer

Who are in the management team of Igarashi Motors?

11-Jun-2026

The management team of Igarashi Motors includes R Chandrasekaran (Managing Director), Hemant Nerurkar (Chairman), K K Nohria (Chairman Emeritus), P Dinakara Babu (Company Secretary), and several independent directors, overseeing the company's operations and strategy.

The management team of Igarashi Motors includes the following individuals:<BR><BR>1. **R Chandrasekaran** - Managing Director<BR>2. **Hemant Nerurkar** - Chairman (Non-Executive)<BR>3. **K K Nohria** - Chairman Emeritus<BR>4. **P Dinakara Babu** - Company Secretary & Compliance Officer<BR>5. **Vinodhini Sendhil Manian** - Independent Director<BR>6. **L Ramkumar** - Independent Director<BR>7. **Haruo Igarashi** - Director<BR>8. **Thomas Francis Mckeough** - Director<BR><BR>This team is responsible for overseeing the company's operations and strategic direction.

View full answer

Who are the peers of the Igarashi Motors?

11-Jun-2026

Igarashi Motors' peers include Auto.Corp.of Goa, India Motor Part, Precision Camshf, Sar Auto Prod., Kross Ltd, Saint-Gob. Sekur, Bharat Seats, The Hi-Tech Gear, Alicon Cast, and GKW. Bharat Seats shows the highest 1-year return at 71.57%, while Igarashi Motors has a return of -26.98%.

Peers: The peers of Igarashi Motors are Auto.Corp.of Goa, India Motor Part, Precision Camshf, Sar Auto Prod., Kross Ltd, Saint-Gob. Sekur, Bharat Seats, The Hi-Tech Gear, Alicon Cast, and GKW.<BR><BR>Quality Snapshot: Excellent management risk is observed at Alicon Cast, while Average management risk is found at Auto.Corp.of Goa, India Motor Part, Precision Camshf, Kross Ltd, Saint-Gob. Sekur, Bharat Seats, The Hi-Tech Gear, and GKW, and Below Average management risk is noted at Sar Auto Prod. and GKW. Growth is Excellent at Bharat Seats, Good at Auto.Corp.of Goa and Saint-Gob. Sekur, while Below Average growth is seen at India Motor Part, Precision Camshf, Sar Auto Prod., Igarashi Motors, Kross Ltd, and The Hi-Tech Gear, with Average growth at Alicon Cast. Capital Structure is Excellent at Auto.Corp.of Goa, Kross Ltd, and Saint-Gob. Sekur, Good at Precision Camshf and Sar Auto Prod., Average at Bharat Seats and The Hi-Tech Gear, and Below Average at Igarashi Motors and Alicon Cast.<BR><BR>Return Snapshot: Bharat Seats has the highest 1-year return at 71.57%, while Precision Camshf has the lowest at -37.13%. Igarashi Motors' 1-year return is -26.98%, which is significantly lower than Bharat Seats and higher than Precision Camshf. Additionally, the six-month return is negative for Igarashi Motors, Precision Camshf, Kross Ltd, Alicon Cast, and The Hi-Tech Gear.

View full answer

What does Igarashi Motors do?

10-Jun-2026

Igarashi Motors India Ltd produces and exports Permanent Magnet DC Motors for automotive applications. As of March 2026, it reported net sales of 226 Cr and a net profit of 2 Cr, with a market cap of INR 1,176 Cr.

Overview: <BR>Igarashi Motors India Ltd is engaged in the production and export of Permanent Magnet DC Motors for powertrain and seat applications within the auto components and equipment industry, classified as a micro-cap company.<BR><BR>History: <BR>Igarashi Motors India Limited was incorporated in January 1992 and began its operations as a contract manufacturer in 1996. The latest quarterly results reported net sales and net profit for the period ending March 2026.<BR><BR>Financial Snapshot: <BR>Net Sales: 226 Cr (Quarterly Results - Mar 2026) <BR>Net Profit: 2 Cr (Quarterly Results - Mar 2026) <BR>Market Cap: INR 1,176 Cr (Micro Cap)<BR><BR>Key Metrics: <BR>P/E: 96.00 <BR>Industry P/E: 36 <BR>Dividend Yield: 0.67% <BR>Debt-Equity: 0.30 <BR>Return on Equity: 2.60% <BR>Price to Book: 2.52<BR><BR>Contact Details: <BR>Address: Plots No B-12 to B-15 Phase II, MEPZ-SEZ Tambaram Chennai Tamil Nadu : 600045 <BR>Tel: 91-044-22628199/42298199 <BR>Email: investorservices@igarashimtors.co.i <BR>Website: http://www.igusa.com

View full answer

Are Igarashi Motors India Ltd latest results good or bad?

22-May-2026

Igarashi Motors India Ltd's latest results are concerning, showing a 48.04% decline in net profit to ₹1.59 crore despite record net sales of ₹225.97 crore, indicating challenges in profitability and operating margins due to increased costs and a high tax rate.

Igarashi Motors India Ltd's latest results indicate a challenging situation for the company. In Q4 FY26, the company reported a net profit of ₹1.59 crore, which represents a significant decline of 48.04% compared to the previous quarter. This sharp drop in profitability is concerning, especially given that the operating margin has also decreased to 8.53%, marking the lowest level in eight quarters.<BR><BR>On a more positive note, the company achieved record net sales of ₹225.97 crore, reflecting a year-on-year growth of 19.26%. However, this revenue growth has not translated into improved profitability, as evidenced by the substantial increase in the tax rate to 42.18%, which severely impacted post-tax profits.<BR><BR>Overall, while Igarashi Motors demonstrated strong revenue growth, the drastic decline in net profit and operating margins raises significant concerns about its financial health and operational efficiency. Investors may view these results as unfavorable, particularly in light of the company's struggles to maintain profitability amidst rising costs and tax burdens.

View full answer

Should I buy, sell or hold Igarashi Motors India Ltd?

22-May-2026

When is the next results date for Igarashi Motors India Ltd?

13-May-2026

The next results date for Igarashi Motors India Ltd is 21 May 2026.

The next results date for Igarashi Motors India Ltd is scheduled for 21 May 2026.

View full answer

Is Igarashi Motors overvalued or undervalued?

18-Nov-2025

As of November 17, 2025, Igarashi Motors is overvalued with a PE ratio of 97.93 and low financial performance indicators, significantly underperforming the Sensex, which suggests it has moved from a fair to an expensive valuation grade compared to its peers.

As of 17 November 2025, Igarashi Motors has moved from a fair to an expensive valuation grade. The company is currently overvalued, with a PE ratio of 97.93, a Price to Book Value of 3.22, and an EV to EBITDA ratio of 18.87. In comparison to its peers, Samvardhana Motherson has a more attractive PE ratio of 34.26, while Bosch, which is rated as fair, has a PE of 48.45. These comparisons highlight the significant premium at which Igarashi Motors is trading relative to its industry peers.<BR><BR>The company's financial performance reflects challenges, with a low ROCE of 5.31% and ROE of 3.29%. Additionally, Igarashi Motors has underperformed the Sensex significantly, with a year-to-date return of -33.64% compared to the Sensex's gain of 8.72%. This underperformance, coupled with its high valuation ratios, reinforces the conclusion that Igarashi Motors is overvalued in the current market environment.

View full answer

How has been the historical performance of Igarashi Motors?

12-Nov-2025

Igarashi Motors has shown consistent growth in net sales and operating profit from Mar'21 to Mar'25, with net sales increasing to 838.42 Cr and operating profit recovering to 97.44 Cr. However, rising raw material costs have led to fluctuating profit margins, with a PAT margin of 2.88% in Mar'25 compared to 4.81% in Mar'21.

Answer:<BR>The historical performance of Igarashi Motors shows a trend of increasing net sales and operating profit over the years, with significant fluctuations in profit margins and cash flow.<BR><BR>Breakdown:<BR>Igarashi Motors has demonstrated a consistent growth in net sales, rising from 532.86 Cr in Mar'21 to 838.42 Cr in Mar'25. This growth is accompanied by an increase in total operating income, which also reached 838.42 Cr in Mar'25. The raw material costs have increased significantly, from 319.85 Cr in Mar'21 to 544.79 Cr in Mar'25, impacting the operating profit, which has shown a recovery to 97.44 Cr in Mar'25 after a dip in previous years. The profit before tax has improved to 32.51 Cr in Mar'25, up from just 2.31 Cr in Mar'22, while profit after tax has also increased to 24.17 Cr in Mar'25 from 1.19 Cr in Mar'22. However, the profit margins have fluctuated, with the PAT margin at 2.88% in Mar'25 compared to 4.81% in Mar'21. On the balance sheet, total liabilities have increased to 775.01 Cr in Mar'25, while total assets have also risen to the same figure, indicating a stable financial position. Cash flow from operating activities has improved to 93.00 Cr in Mar'25, reflecting better operational efficiency, although cash flow from investing activities remains negative at -90.00 Cr. Overall, while Igarashi Motors has shown growth in sales and profits, it faces challenges with rising costs and fluctuating profit margins.

View full answer

Is Igarashi Motors technically bullish or bearish?

31-Oct-2025

As of October 30, 2025, Igarashi Motors is in a bearish trend with moderate strength, indicated by bearish moving averages, MACD, KST, and Bollinger Bands across multiple timeframes, alongside a significant decline in performance compared to the Sensex.

As of 30 October 2025, the technical trend has changed from mildly bearish to bearish. The current technical stance for Igarashi Motors is bearish with moderate strength. Key indicators driving this stance include the bearish moving averages on the daily timeframe, the bearish MACD on the monthly timeframe, and the overall bearish signals from KST and Bollinger Bands on both weekly and monthly timeframes. Additionally, the Dow Theory indicates a mildly bearish outlook on the weekly and monthly charts. The stock's recent performance shows a significant decline year-to-date and over the past year compared to the Sensex, reinforcing the bearish sentiment.

View full answer

Who are the top shareholders of the Igarashi Motors?

06-Jun-2025

The top shareholders of Igarashi Motors include Agile Electric Sub Assembly Pvt Ltd with 54.46%, followed by individual investors at 16.3%, Ginni Finance Pvt. Ltd. at 1.5%, mutual funds at 0.66%, and foreign institutional investors at 1.15%.

The top shareholders of Igarashi Motors are primarily the promoters, with Agile Electric Sub Assembly Pvt Ltd holding the largest share at 54.46%. In addition to the promoters, there are mutual funds that hold 0.66% through one scheme, and foreign institutional investors (FIIs) hold 1.15% across 20 different FIIs. The highest public shareholder is Ginni Finance Pvt. Ltd., which holds 1.5%. Individual investors collectively hold 16.3% of the shares.

View full answer

What is the bonus history of the Igarashi Motors?

06-Jun-2025

Igarashi Motors announced a bonus issue on September 27, 2018, offering shareholders 25 additional shares for every 202 shares held, with a record date of September 28, 2018.

Igarashi Motors has a bonus history that includes a notable issue announced on September 27, 2018. The company declared a bonus in the ratio of 25:202, with the record date set for September 28, 2018. This means that for every 202 shares held, shareholders received an additional 25 shares. If you have any more questions about Igarashi Motors or need further details, feel free to ask!

View full answer

Has Igarashi Motors declared dividend?

06-Jun-2025

Igarashi Motors India Ltd has declared a 10% dividend, amounting to ₹1 per share, with an ex-date of July 31, 2024. The dividend yield is 0.2%, and total returns have varied significantly across different periods, with a notable 108.44% total return over the past 5 years.

Igarashi Motors India Ltd has declared a 10% dividend.<BR><BR>Dividend Details:<BR>- Percentage announced: 10%<BR>- Amount per share: 1 per share<BR>- Ex-date: 31 Jul 24<BR><BR>Dividend Yield: 0.2%.<BR><BR>Total Returns by Period:<BR>In the last 6 months, the price return was -38.69%, with a dividend return of 0%, resulting in a total return of -38.69%.<BR><BR>Over the past year, the price return was 3.97%, the dividend return was 0.20%, leading to a total return of 4.17%.<BR><BR>In the 2-year period, the price return was 0.86%, the dividend return was 0.40%, culminating in a total return of 1.26%.<BR><BR>For the 3-year period, the price return was 71.98%, the dividend return was 0.77%, resulting in a total return of 72.75%.<BR><BR>In the last 4 years, the price return was 15.15%, with a dividend return of 0.71%, giving a total return of 15.86%.<BR><BR>Over the past 5 years, the price return was 106.81%, the dividend return was 1.63%, leading to a total return of 108.44%.<BR><BR>Overall, Igarashi Motors has declared a dividend, albeit with a modest yield, while the total returns over various periods show significant fluctuations, particularly a strong performance over the 5-year period.

View full answer
iScoreScore
Click here to find our call on this stock
Strong Sell
Sell
Hold
Buy
Strong Buy

Dashboard

1

Weak Long Term Fundamental Strength with a -2.42% CAGR growth in Operating Profits over the last 5 years

  • Company's ability to service its debt is weak with a poor EBIT to Interest (avg) ratio of 1.77
  • The company has been able to generate a Return on Equity (avg) of 2.28% signifying low profitability per unit of shareholders funds
2

Negative results in Mar 26

3

With ROCE of 4.2, it has a Expensive valuation with a 2.4 Enterprise value to Capital Employed

4

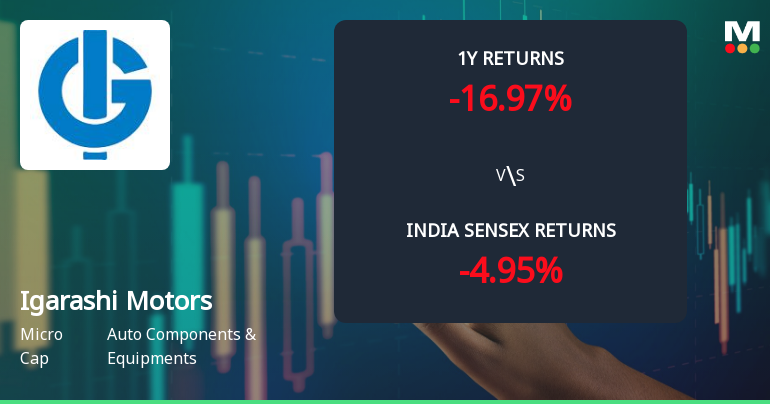
Consistent Underperformance against the benchmark over the last 3 years

stock-summaryMojo Parameters

Mojo Parameters

Loading Valuation Snapshot...

Stock DNA

stock-summary
Industry

Auto Components & Equipments

stock-summary
Market cap

INR 1,253 Cr (Micro Cap)

stock-summary
P/E

108.00

stock-summary
Industry P/E

37

stock-summary
Dividend Yield

0.63%

stock-summary
Debt Equity

0.30

stock-summary
Return on Equity

2.60%

stock-summary
Price to Book

2.67

Revenue and Profits:
Net Sales:
226 Cr
(Quarterly Results - Mar 2026)
Net Profit:
2 Cr
stock-summaryTotal Returns
Total Returns (Price + Dividend) stock-summary
Dividend Yield (0.63%)
TimePeriod
Price Return
Dividend Return
Total Return
3 Months
35.22%
0%
35.22%
6 Months
-4.52%
0%
-4.52%
1 Year
-10.81%
0.52%
-10.29%
2 Years
-21.48%
0.73%
-20.75%
3 Years
-17.98%
0.95%
-17.03%
4 Years
53.62%
1.59%
55.21%
5 Years
-9.86%
1.13%
-8.73%

Latest dividend: 2.5 per share ex-dividend date: Jul-31-2025

Risk Adjusted Returns v/s stock-summary
Returns Beta
Icon
Beta has not been calculated since enough price history is not available
stock-summaryNews & Corporate Actions

Announcements stock-summary

Igarashi Motors India Limited - Other General Purpose

09-Dec-2019 | Source : NSE

Igarashi Motors India Limited has submitted to the Exchange a copy of Disclosure of Related Party Transactions for the Half year ended on September 30, 2019.

Igarashi Motors India Limited - Outcome of Board Meeting

15-Nov-2019 | Source : NSE

Igarashi Motors India Limited has informed the Exchange regarding Board meeting held on November 14, 2019.

Igarashi Motors India Limited - Shareholders meeting

08-Nov-2019 | Source : NSE

Igarashi Motors India Limited has informed the Exchange regarding Proceedings of Postal Ballot

Corporate Actions stock-summary

stock-summary
BOARD MEETING

No Upcoming Board Meetings

stock-summary
DIVIDEND

Igarashi Motors India Ltd has declared 25% dividend, ex-date: 31 Jul 25

stock-summary
SPLITS

No Splits history available

stock-summary
BONUS

Igarashi Motors India Ltd has announced 25:202 bonus issue, ex-date: 27 Sep 18

stock-summary
RIGHTS

No Rights history available

stock-summaryKey Factors

Quality key factors stock-summary

Factor
Value
Sales Growth (5y)
10.20%
EBIT Growth (5y)
-2.42%
EBIT to Interest (avg)
1.77
Debt to EBITDA (avg)
1.87
Net Debt to Equity (avg)
0.30
Sales to Capital Employed (avg)
1.24
Tax Ratio
26.47%
Dividend Payout Ratio
32.56%
Pledged Shares
0
Institutional Holding
2.26%
ROCE (avg)
4.14%
ROE (avg)
2.28%

Valuation key factors

Factor
Value
P/E Ratio
108
Industry P/E
37
Price to Book Value
2.82
EV to EBIT
56.64
EV to EBITDA
17.62
EV to Capital Employed
2.40
EV to Sales
1.68
PEG Ratio
NA
Dividend Yield
0.60%
ROCE (Latest)
4.23%
ROE (Latest)
2.60%

Technicals key factors

Indicator
Weekly
Monthly
MACD
Mildly Bullish
Bearish
RSI
No Signal
No Signal
Bollinger Bands
Bullish
Mildly Bearish
Moving Averages
Mildly Bearish (Daily)
KST
Bullish
Bearish
Dow Theory
Mildly Bullish
Mildly Bullish
OBV
Bullish
Bullish
stock-summary Technical Indicator Scale: Bearish, Mildly Bearish, Sideways, Mildly Bullish, Bullish  Turned 
stock-summaryShareholding
Shareholding Snapshot : Mar 2026stock-summary
Shareholding Compare (%holding) stock-summary
Majority shareholders

Promoters

Pledged Promoter Holdings

None

Mutual Funds

Held by 1 Schemes (0.74%)

FIIs

Held by 6 FIIs (0.13%)

Promoter with highest holding

Agile Electric Sub Assembly Pvt Ltd (54.46%)

Highest Public shareholder

Ginni Finance Pvt. Ltd. (1.3%)

Individual Investors Holdings

17.7%

stock-summaryFinancial
[
  {
    "link": "quarterly",
    "btn_text": "All Quarterly Results",
    "header": "Quarterly Results Snapshot (Standalone) - Mar'26 - QoQ",
    "rhs": [
      {
        "prefix": "Net Sales ",
        "suffix": "QoQ Growth in quarter ended Mar 2026 is 4.57% vs -1.39% in Dec 2025",
        "dir": 1
      },
      {
        "prefix": "Standalone Net Profit ",
        "suffix": "QoQ Growth in quarter ended Mar 2026 is -54.57% vs -22.91% in Dec 2025",
        "dir": -1
      }
    ],
    "table": {
      "header": [
        "Mar'26",
        "Dec'25",
        "Change(%)"
      ],
      "body": [
        {
          "field": "Net Sales",
          "val1": "225.97",
          "val2": "216.09",
          "chgp": "4.57%",
          "chgp_class": "positive"
        },
        {
          "field": "Operating Profit (PBDIT) excl Other Income",
          "val1": "19.27",
          "val2": "20.39",
          "chgp": "-5.49%",
          "chgp_class": "negative"
        },
        {
          "field": "Interest",
          "val1": "2.48",
          "val2": "2.09",
          "chgp": "18.66%",
          "chgp_class": "negative"
        },
        {
          "field": "Exceptional Items",
          "val1": "0.00",
          "val2": "0.00",
          "chgp": "",
          "chgp_class": "neutral"
        },
        {
          "field": "Standalone Net Profit",
          "val1": "1.59",
          "val2": "3.50",
          "chgp": "-54.57%",
          "chgp_class": "negative"
        },
        {
          "field": "Operating Profit Margin (Excl OI)",
          "val1": "8.53%",
          "val2": "9.44%",
          "chgp": "-0.91%",
          "chgp_class": "negative"
        }
      ]
    }
  },
  {
    "link": "half-yearly",
    "btn_text": "All Half Yearly Results",
    "header": "Half Yearly Results Snapshot (Standalone) - Sep'25",
    "rhs": [
      {
        "prefix": "Net Sales ",
        "suffix": " Growth in half year ended Sep 2025 is -3.26% vs 26.38% in Sep 2024",
        "dir": -1
      },
      {
        "prefix": "Standalone Net Profit ",
        "suffix": " Growth in half year ended Sep 2025 is -55.80% vs 453.82% in Sep 2024",
        "dir": -1
      }
    ],
    "table": {
      "header": [
        "Sep'25",
        "Sep'24",
        "Change(%)"
      ],
      "body": [
        {
          "field": "Net Sales",
          "val1": "423.86",
          "val2": "438.14",
          "chgp": "-3.26%",
          "chgp_class": "negative"
        },
        {
          "field": "Operating Profit (PBDIT) excl Other Income",
          "val1": "43.07",
          "val2": "51.60",
          "chgp": "-16.53%",
          "chgp_class": "negative"
        },
        {
          "field": "Interest",
          "val1": "6.42",
          "val2": "6.93",
          "chgp": "-7.36%",
          "chgp_class": "positive"
        },
        {
          "field": "Exceptional Items",
          "val1": "0.00",
          "val2": "0.00",
          "chgp": "",
          "chgp_class": "neutral"
        },
        {
          "field": "Standalone Net Profit",
          "val1": "7.05",
          "val2": "15.95",
          "chgp": "-55.80%",
          "chgp_class": "negative"
        },
        {
          "field": "Operating Profit Margin (Excl OI)",
          "val1": "10.16%",
          "val2": "11.78%",
          "chgp": "-1.62%",
          "chgp_class": "negative"
        }
      ]
    }
  },
  {
    "link": "nine-monthly",
    "btn_text": "All Nine Monthly Results",
    "header": "Nine Monthly Results Snapshot (Standalone) - Dec'25",
    "rhs": [
      {
        "prefix": "Net Sales ",
        "suffix": "YoY Growth in nine months ended Dec 2025 is -1.39% vs 24.69% in Dec 2024",
        "dir": -1
      },
      {
        "prefix": "Standalone Net Profit ",
        "suffix": "YoY Growth in nine months ended Dec 2025 is -50.02% vs 375.45% in Dec 2024",
        "dir": -1
      }
    ],
    "table": {
      "header": [
        "Dec'25",
        "Dec'24",
        "Change(%)"
      ],
      "body": [
        {
          "field": "Net Sales",
          "val1": "639.95",
          "val2": "648.94",
          "chgp": "-1.39%",
          "chgp_class": "negative"
        },
        {
          "field": "Operating Profit (PBDIT) excl Other Income",
          "val1": "63.46",
          "val2": "75.33",
          "chgp": "-15.76%",
          "chgp_class": "negative"
        },
        {
          "field": "Interest",
          "val1": "8.51",
          "val2": "10.76",
          "chgp": "-20.91%",
          "chgp_class": "positive"
        },
        {
          "field": "Exceptional Items",
          "val1": "0.00",
          "val2": "0.00",
          "chgp": "",
          "chgp_class": "neutral"
        },
        {
          "field": "Standalone Net Profit",
          "val1": "10.55",
          "val2": "21.11",
          "chgp": "-50.02%",
          "chgp_class": "negative"
        },
        {
          "field": "Operating Profit Margin (Excl OI)",
          "val1": "9.92%",
          "val2": "11.61%",
          "chgp": "-1.69%",
          "chgp_class": "negative"
        }
      ]
    }
  },
  {
    "link": "annual",
    "btn_text": "All Annual Results",
    "header": "Annual Results Snapshot (Standalone) - Mar'26",
    "rhs": [
      {
        "prefix": "Net Sales ",
        "suffix": "YoY Growth in year ended Mar 2026 is 3.28% vs 15.64% in Mar 2025",
        "dir": -1
      },
      {
        "prefix": "Standalone Net Profit ",
        "suffix": "YoY Growth in year ended Mar 2026 is -49.73% vs 152.56% in Mar 2025",
        "dir": -1
      }
    ],
    "table": {
      "header": [
        "Mar'26",
        "Mar'25",
        "Change(%)"
      ],
      "body": [
        {
          "field": "Net Sales",
          "val1": "865.92",
          "val2": "838.42",
          "chgp": "3.28%",
          "chgp_class": "positive"
        },
        {
          "field": "Operating Profit (PBDIT) excl Other Income",
          "val1": "82.73",
          "val2": "95.05",
          "chgp": "-12.96%",
          "chgp_class": "negative"
        },
        {
          "field": "Interest",
          "val1": "11.00",
          "val2": "13.39",
          "chgp": "-17.85%",
          "chgp_class": "positive"
        },
        {
          "field": "Exceptional Items",
          "val1": "0.00",
          "val2": "0.00",
          "chgp": "",
          "chgp_class": "neutral"
        },
        {
          "field": "Standalone Net Profit",
          "val1": "12.15",
          "val2": "24.17",
          "chgp": "-49.73%",
          "chgp_class": "negative"
        },
        {
          "field": "Operating Profit Margin (Excl OI)",
          "val1": "9.55%",
          "val2": "11.34%",
          "chgp": "-1.79%",
          "chgp_class": "negative"
        }
      ]
    }
  }
]

Quarterly Results Snapshot (Standalone) - Mar'26 - QoQstock-summary

Mar'26
Dec'25
Change(%)
Net Sales
225.97
216.09
4.57%
Operating Profit (PBDIT) excl Other Income
19.27
20.39
-5.49%
Interest
2.48
2.09
18.66%
Exceptional Items
0.00
0.00
Standalone Net Profit
1.59
3.50
-54.57%
Operating Profit Margin (Excl OI)
8.53%
9.44%
-0.91%
Values in Rs Cr.
Direction Arrows
Net Sales

QoQ Growth in quarter ended Mar 2026 is 4.57% vs -1.39% in Dec 2025

Direction Arrows
Standalone Net Profit

QoQ Growth in quarter ended Mar 2026 is -54.57% vs -22.91% in Dec 2025

Half Yearly Results Snapshot (Standalone) - Sep'25stock-summary

Sep'25
Sep'24
Change(%)
Net Sales
423.86
438.14
-3.26%
Operating Profit (PBDIT) excl Other Income
43.07
51.60
-16.53%
Interest
6.42
6.93
-7.36%
Exceptional Items
0.00
0.00
Standalone Net Profit
7.05
15.95
-55.80%
Operating Profit Margin (Excl OI)
10.16%
11.78%
-1.62%
Values in Rs Cr.
Direction Arrows
Net Sales

Growth in half year ended Sep 2025 is -3.26% vs 26.38% in Sep 2024

Direction Arrows
Standalone Net Profit

Growth in half year ended Sep 2025 is -55.80% vs 453.82% in Sep 2024

Nine Monthly Results Snapshot (Standalone) - Dec'25stock-summary

Dec'25
Dec'24
Change(%)
Net Sales
639.95
648.94
-1.39%
Operating Profit (PBDIT) excl Other Income
63.46
75.33
-15.76%
Interest
8.51
10.76
-20.91%
Exceptional Items
0.00
0.00
Standalone Net Profit
10.55
21.11
-50.02%
Operating Profit Margin (Excl OI)
9.92%
11.61%
-1.69%
Values in Rs Cr.
Direction Arrows
Net Sales

YoY Growth in nine months ended Dec 2025 is -1.39% vs 24.69% in Dec 2024

Direction Arrows
Standalone Net Profit

YoY Growth in nine months ended Dec 2025 is -50.02% vs 375.45% in Dec 2024

Annual Results Snapshot (Standalone) - Mar'26stock-summary

Mar'26
Mar'25
Change(%)
Net Sales
865.92
838.42
3.28%
Operating Profit (PBDIT) excl Other Income
82.73
95.05
-12.96%
Interest
11.00
13.39
-17.85%
Exceptional Items
0.00
0.00
Standalone Net Profit
12.15
24.17
-49.73%
Operating Profit Margin (Excl OI)
9.55%
11.34%
-1.79%
Values in Rs Cr.
Direction Arrows
Net Sales

YoY Growth in year ended Mar 2026 is 3.28% vs 15.64% in Mar 2025

Direction Arrows
Standalone Net Profit

YoY Growth in year ended Mar 2026 is -49.73% vs 152.56% in Mar 2025

stock-summaryCompany CV
About Igarashi Motors India Ltd stock-summary
stock-summary
Igarashi Motors India Ltd
Micro Cap
Auto Components & Equipments
Igarashi Motors India Limited incorporated in January, 1992 is engaged in the production and export of Permanent Magnet DC Motors for Powertrain and seat applications and motor accessories for the automotive sector. The company came out with a Rs 2.77-cr public issue in Jan.'94 to part-finance a 100% EOU to manufacture permanent magnet DC micro motors. Total project cost was at Rs 10 cr. The Company commenced its journey as a humble contract manufacturer in 1996.
Company Coordinates stock-summary
Company Details
Plots No B-12 to B-15 Phase II, MEPZ-SEZ Tambaram Chennai Tamil Nadu : 600045
stock-summary
Tel: 91-044-22628199/42298199
stock-summary
investorservices@igarashimtors.co.i
Registrar Details
Cameo Corporate Services Ltd , Subramanian Buildings No 1 , Club House Road, Chennai