
Compare Igarashi Motors with Similar Stocks
Dashboard
Weak Long Term Fundamental Strength with a -2.42% CAGR growth in Operating Profits over the last 5 years
- Company's ability to service its debt is weak with a poor EBIT to Interest (avg) ratio of 1.77
- The company has been able to generate a Return on Equity (avg) of 2.28% signifying low profitability per unit of shareholders funds
Negative results in Mar 26
With ROCE of 4.2, it has a Expensive valuation with a 2.1 Enterprise value to Capital Employed
Consistent Underperformance against the benchmark over the last 3 years
Stock DNA
Auto Components & Equipments
INR 1,176 Cr (Micro Cap)
96.00
36
0.67%
0.30
2.60%
2.52
Total Returns (Price + Dividend) 
Latest dividend: 2.5 per share ex-dividend date: Jul-31-2025
Risk Adjusted Returns v/s
Returns Beta

News
Igarashi Motors India Ltd is Rated Strong Sell
Igarashi Motors India Ltd is rated Strong Sell by MarketsMOJO, with this rating last updated on 11 May 2026. However, the analysis and financial metrics discussed here reflect the stock’s current position as of 03 June 2026, providing investors with an up-to-date view of the company’s fundamentals, valuation, financial trends, and technical outlook.
Read full news article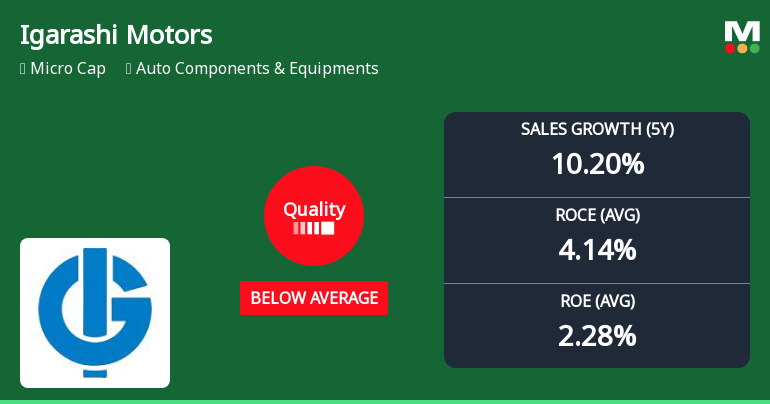
Igarashi Motors India Ltd Quality Grade Downgrade Highlights Fundamental Weaknesses
Igarashi Motors India Ltd has seen its quality grade downgraded from average to below average, reflecting a deterioration in key business fundamentals such as return on equity (ROE), return on capital employed (ROCE), and growth consistency. This downgrade, accompanied by a strong sell mojo grade, underscores mounting concerns over the company’s financial health and operational efficiency amid challenging market conditions.
Read full news article
Igarashi Motors India Ltd is Rated Strong Sell
Igarashi Motors India Ltd is rated Strong Sell by MarketsMOJO, with this rating last updated on 11 May 2026. However, the analysis and financial metrics discussed here reflect the stock's current position as of 23 May 2026, providing investors with the latest insights into the company’s performance and outlook.
Read full news article Announcements
Compliances-Reg.24(A)-Annual Secretarial Compliance
27-May-2026 | Source : BSEAnnual Secretarial Compliance Report for the year ended March 31 2026
Announcement under Regulation 30 (LODR)-Newspaper Publication
22-May-2026 | Source : BSENewspaper Publication
Audited Financial Results For The Quarter And Year Ended March 31 2026 And Board Recommended Dividend For The Year 2025-26
21-May-2026 | Source : BSEAudited Financial Results and Dividend
Corporate Actions

No Upcoming Board Meetings

Igarashi Motors India Ltd has declared 25% dividend, ex-date: 31 Jul 25

No Splits history available

Igarashi Motors India Ltd has announced 25:202 bonus issue, ex-date: 27 Sep 18

No Rights history available
Quality key factors
Valuation key factors
Technicals key factors
 Technical Indicator Scale: Bearish, Mildly Bearish, Sideways, Mildly Bullish, Bullish Turned
 Shareholding Snapshot : Mar 2026
Shareholding Compare (%holding)
Promoters
None
Held by 1 Schemes (0.74%)
Held by 6 FIIs (0.13%)
Agile Electric Sub Assembly Pvt Ltd (54.46%)
Ginni Finance Pvt. Ltd. (1.3%)
17.7%
Quarterly Results Snapshot (Standalone) - Mar'26 - QoQ

QoQ Growth in quarter ended Mar 2026 is 4.57% vs -1.39% in Dec 2025

QoQ Growth in quarter ended Mar 2026 is -54.57% vs -22.91% in Dec 2025
Half Yearly Results Snapshot (Standalone) - Sep'25
Growth in half year ended Sep 2025 is -3.26% vs 26.38% in Sep 2024
Growth in half year ended Sep 2025 is -55.80% vs 453.82% in Sep 2024
Nine Monthly Results Snapshot (Standalone) - Dec'25
YoY Growth in nine months ended Dec 2025 is -1.39% vs 24.69% in Dec 2024
YoY Growth in nine months ended Dec 2025 is -50.02% vs 375.45% in Dec 2024
Annual Results Snapshot (Standalone) - Mar'26
YoY Growth in year ended Mar 2026 is 3.28% vs 15.64% in Mar 2025
YoY Growth in year ended Mar 2026 is -49.73% vs 152.56% in Mar 2025
About Igarashi Motors India Ltd

Company Coordinates


