IGC Industries

  • Market Cap: Micro Cap
  • Industry: Trading & Distributors
  • ISIN: INE099S01016
  • NSEID:
  • BSEID: 539449
INR
2.12
-0.12 (-5.36%)
BSENSE

Jan 19

BSE+NSE Vol: 1.87 lacs

  • Price Points
  • Score
  • Mojo Parameters
  • Total Return
  • News and Corporate Actions
  • Key factors
  • Shareholding
  • Financials
  • CompanyCV
stock-summaryPrice Point
High/Low

1Day

52 Week

Valuation
Technical
Day's Volume

CASH

1.87 lacs (810.02%) Volume

Shareholding (Dec 2025)

FII

0.00%

Held by 0 FIIs

DII

0.00%

Held by 0 DIIs

Promoter

0.00%

What does IGC Industries do?

06-Jun-2025

IGC Industries Ltd, a Micro Cap company in the Trading & Distributors industry, was incorporated in 1980 and has undergone several name changes, with its latest quarterly results showing a net profit of 0 Cr and a market cap of Rs 18 Cr. The company has a negative debt-equity ratio of -0.40 and a return on equity of -35.00%.

Overview: <BR>IGC Industries Ltd operates in the Trading & Distributors industry and is categorized as a Micro Cap company.<BR><BR>History: <BR>The company was incorporated in 1980 as Maxwell Traders and Exporters Limited. It changed its name to IGC Foils Limited in 1998 and subsequently to IGC Industries Limited in September 2016. The most recent quarterly results reported are for December 2024.<BR><BR>Financial Snapshot: <BR>Most recent Net Sales: N/A <BR>Most recent Net Profit: 0 Cr (Quarterly Results - Dec 2024) <BR>Market-cap value: Rs 18 Cr (Micro Cap)<BR><BR>Key Metrics: <BR>P/E: N/A <BR>Industry P/E: 8 <BR>Dividend Yield: 0.00% <BR>Debt-Equity: -0.40 <BR>Return on Equity: -35.00% <BR>Price-to-Book: 18.75<BR><BR>Contact Details: <BR>Address: Imax Lohia Square Office No 4B, 4th Flr Gangadhar Babu Lane Kolkata West Bengal : 700012 <BR>Tel: 91-22-28020017/18 <BR>Email: igcfoils@gmail.com <BR>Website: http://www.igcindustriesltd.com

View full answer

Has IGC Industries declared dividend?

06-Jun-2025

No Dividend History Available

Who are the peers of the IGC Industries?

03-Jun-2025

IGC Industries' peers include Redington, MMTC, MSTC, Ravindra Energy, Euro Asia Export, Oswal Yarns, Sumeru Industrie, Diggi Multitrade, and A F Enterprises. Euro Asia Export has the highest 1-year return at 704.62%, while IGC Industries has the lowest at -88.04%.

Peers: The peers of IGC Industries are Redington, MMTC, MSTC, Ravindra Energy, Euro Asia Export, Oswal Yarns, Sumeru Industrie, Diggi Multitrade, and A F Enterprises.<BR><BR>Quality Snapshot: Excellent management risk is observed at Redington, while Average management risk is found at MMTC and MSTC, and the rest have Below Average management risk. Growth is Excellent at Redington, Average at Euro Asia Export, and Below Average at MMTC, MSTC, Ravindra Energy, Oswal Yarns, Sumeru Industrie, Diggi Multitrade, and A F Enterprises. Capital Structure is Excellent at MSTC, Good at Redington, and Below Average at MMTC, Ravindra Energy, Euro Asia Export, Oswal Yarns, Sumeru Industrie, Diggi Multitrade, and A F Enterprises.<BR><BR>Return Snapshot: The peer with the highest 1-year return is Euro Asia Export at 704.62%, while IGC Industries has the lowest at -88.04%. This indicates that IGC Industries' performance is significantly worse compared to its peers. Additionally, the six-month return is negative for MSTC, IGC Industries, Oswal Yarns, A F Enterprises, and Ravindra Energy.

View full answer

Is IGC Industries overvalued or undervalued?

09-Jun-2025

As of April 25, 2023, IGC Industries is classified as "risky" and overvalued with a negative PE ratio of -18.19 and negative ROCE of -39.00%, significantly underperforming against peers like Hindalco and National Aluminium, and the Sensex, with a year-to-date return of -46.61%.

As of 25 April 2023, IGC Industries has moved from a grade of "does not qualify" to "risky." The company is currently overvalued, as indicated by its negative PE ratio of -18.19 and a negative ROCE of -39.00%. Additionally, the EV to EBITDA ratio stands at -17.79, reflecting significant operational challenges. <BR><BR>In comparison to its peers, IGC Industries' valuation contrasts sharply with Hindalco Industries Ltd., which has a PE ratio of 8.8 and an EV to EBITDA of 5.93, categorizing it as "very attractive." National Aluminium Co. Ltd. also presents a more favorable valuation with a PE of 6.57 and an EV to EBITDA of 4.05, marking it as "attractive." Furthermore, IGC Industries has underperformed significantly against the Sensex, with a year-to-date return of -46.61% compared to the Sensex's 5.60%.

View full answer

What is the technical trend for IGC Industries?

09-Jun-2025

As of June 6, 2025, IGC Industries shows a mildly bearish trend with daily moving averages indicating bearish momentum, while weekly indicators suggest short-term strength, resulting in mixed signals and a prevailing bearish outlook in longer time frames.

As of 6 June 2025, the technical trend for IGC Industries has changed from bearish to mildly bearish. The current stance is mildly bearish, driven by the daily moving averages indicating bearish momentum, while the weekly MACD and KST show mildly bullish signals, suggesting some short-term strength. The weekly RSI is bullish, but the monthly indicators, including MACD and Bollinger Bands, remain bearish. Overall, the mixed signals indicate a lack of strong conviction in either direction, with the bearish trend prevailing in the longer time frames.

View full answer

Who are in the management team of IGC Industries?

16-Jul-2025

As of March 2022, the management team of IGC Industries includes Prachi Marwah (Managing Director & CFO), Jayalal Pathak, Vishal Sonawane, and Vinod Kacharu Mokal (all Independent Directors). They are responsible for the company's governance and strategic direction.

As of March 2022, the management team of IGC Industries includes the following members:<BR><BR>1. Prachi Marwah - Managing Director & CFO<BR>2. Jayalal Pathak - Independent Director<BR>3. Vishal Sonawane - Independent Director<BR>4. Vinod Kacharu Mokal - Independent Director<BR><BR>Each of these individuals plays a key role in the governance and strategic direction of the company.

View full answer

Who are the top shareholders of the IGC Industries?

17-Jul-2025

The top shareholders of IGC Industries include individual investors with 70.3% of shares, Vardip Globstrat Trading Private Limited holding 10.19%, and one foreign institutional investor with 1.4%. Notably, Disha Abhishek Mehta is the promoter with the highest holding, listed at 0.0%, and there are no pledged promoter holdings or mutual funds involved.

The top shareholders of IGC Industries include individual investors, who hold a significant 70.3% of the shares. The highest public shareholder is Vardip Globstrat Trading Private Limited, with a stake of 10.19%. Additionally, there is one foreign institutional investor (FII) that holds 1.4% of the shares. The promoter with the highest holding is Disha Abhishek Mehta, although her stake is listed as 0.0%. There are no pledged promoter holdings and no mutual funds currently holding shares in the company.

View full answer

How big is IGC Industries?

24-Jul-2025

As of 24th July, IGC Industries Ltd has a market capitalization of 14.00 Cr, with net sales of 1.99 Cr and a net loss of 0.01 Cr over the latest four quarters. Shareholder's funds are 0.71 Cr, and total assets are 10.43 Cr as of March 2024.

As of 24th July, IGC Industries Ltd has a market capitalization of 14.00 Cr, categorizing it as a Micro Cap company.<BR><BR>In the latest four quarters, IGC Industries reported net sales of 1.99 Cr. The net profit for the same period was a loss of 0.01 Cr.<BR><BR>The latest annual period for the balance sheet is March 2024. Shareholder's funds were recorded at 0.71 Cr, while total assets amounted to 10.43 Cr.

View full answer

Are IGC Industries latest results good or bad?

14-Aug-2025

IGC Industries' latest results are concerning, with net sales and standalone net profit both dropping significantly, leading to a negative operating profit margin. The company has received a 'Strong Sell' recommendation, indicating a negative outlook for its future performance.

The latest results for IGC Industries indicate a concerning financial performance. The company reported a significant decline in key metrics for the quarter ending December 2024, with net sales dropping by 100% compared to the previous quarter. This decline is mirrored in the standalone net profit, which saw a decrease of 200%. <BR><BR>Additionally, the operating profit margin turned negative, reflecting operational challenges. The overall score for the company has fallen to 0 from 7 over the last three months, signaling a lack of growth or improvement. Furthermore, MarketsMOJO has issued a 'Strong Sell' recommendation, which suggests a negative outlook on the stock's future performance.<BR><BR>In summary, the financial results are not favorable, and stakeholders should be cautious as the company navigates these challenges in the aluminium sector.

View full answer

When is the next results date for IGC Industries?

13-Nov-2025

The next results date for IGC Industries is 14 November 2025.

The next results date for IGC Industries is scheduled for 14 November 2025.

View full answer

How has been the historical performance of IGC Industries?

15-Nov-2025

IGC Industries has experienced significant fluctuations in financial performance, with a recent increase in sales to 1.99 Cr in March 2025, but ongoing losses and rising liabilities, resulting in negative operating profit and cash flow. The company has struggled with profitability since 2019, reflecting a troubling financial trend.

Answer:<BR>The historical performance of IGC Industries shows significant fluctuations in financial metrics over the years, with a notable decline in revenue and profitability.<BR><BR>Breakdown:<BR>IGC Industries reported net sales of 1.99 Cr in March 2025, a substantial increase from previous years where sales were either negligible or non-existent, such as 0.00 Cr in March 2024 and March 2023. However, this is a stark contrast to the peak sales of 49.22 Cr in March 2018. The total operating income followed a similar trend, reaching 1.99 Cr in March 2025, compared to 0.00 Cr in the two preceding years. Despite this modest revenue, the company faced total expenditures of 2.05 Cr in March 2025, leading to an operating profit (PBDIT) of -0.06 Cr, indicating ongoing losses that have persisted since March 2019, where the profit was 0.25 Cr. The profit after tax also remained negative at -0.06 Cr in March 2025, reflecting a consistent decline from a profit of 0.01 Cr in March 2019 and 0.03 Cr in March 2018. The company's total liabilities surged to 54.54 Cr in March 2025, up from 10.43 Cr in March 2024, while total assets also increased to 54.54 Cr, indicating a growing financial burden. Cash flow from operating activities showed a significant outflow of -21.00 Cr in March 2025, further emphasizing the company's financial challenges. Overall, IGC Industries has experienced a troubling trend of declining profitability and increasing liabilities, despite a recent uptick in sales.

View full answer

Should I buy, sell or hold IGC Industries?

16-Nov-2025

Why is IGC Industries Ltd falling/rising?

18-Jan-2026

As of 18-Jan, IGC Industries Ltd's stock price is 2.24, unchanged from the previous session, with significant declines over various time frames, including a 74.60% drop over the past year. The stock is underperforming despite a slight outperformance against its sector, reflecting weak fundamentals and declining investor confidence.

As of 18-Jan, IGC Industries Ltd's stock price is currently at 2.24, showing no change from the previous trading session. The stock has experienced significant declines over various time frames, including a 1-week drop of 5.08%, a 1-month decrease of 13.85%, and a year-to-date decline of 6.28%. Over the past year, the stock has plummeted by 74.60%, while the benchmark Sensex has gained 8.47% during the same period.<BR><BR>Today's performance indicates that IGC Industries has outperformed its sector by 2.34%, despite the overall negative trend in the Aluminium & Aluminium Products sector, which has fallen by 2.34%. However, the stock is trading below its moving averages across multiple time frames, including the 5-day, 20-day, 50-day, 100-day, and 200-day averages, suggesting a bearish trend.<BR><BR>Investor participation has also declined, with delivery volume dropping by 43.39% compared to the 5-day average. This decrease in trading activity reflects a lack of confidence among investors. Additionally, the company has not declared results in the last six months, indicating weak long-term fundamental strength. The high debt-to-equity ratio of 4.90 times and a low return on equity of 0.07% further highlight the company's financial struggles.<BR><BR>Overall, the combination of poor performance metrics, declining investor interest, and weak fundamentals contributes to the falling stock price of IGC Industries Ltd.

View full answer
iScoreScore
Click here to find our call on this stock
Strong Sell
Sell
Hold
Buy
Strong Buy

MarketsMojo — Loved in India, Now Global

The power of Mojo is now in 29 countries. Explore global equities with the same cutting-edge features you love.

Dashboard

1

Weak Long Term Fundamental Strength as the company has not declared results in the last 6 months

  • Poor long term growth as Net Sales has grown by an annual rate of % and Operating profit at 0% over the last 5 years
  • High Debt Company with a Debt to Equity ratio (avg) at 4.90 times
  • The company has been able to generate a Return on Equity (avg) of 0.07% signifying low profitability per unit of shareholders funds
2

Flat results in Jun 25

 
3

Risky - Negative EBITDA

4

Below par performance in long term as well as near term

stock-summaryMojo Parameters

Mojo Parameters

Loading Valuation Snapshot...

Stock DNA

stock-summary
Industry

Trading & Distributors

stock-summary
Market cap

INR 7 Cr (Micro Cap)

stock-summary
P/E

NA (Loss Making)

stock-summary
Industry P/E

12

stock-summary
Dividend Yield

0.00%

stock-summary
Debt Equity

0.00

stock-summary
Return on Equity

-0.14%

stock-summary
Price to Book

0.18

Revenue and Profits:
Net Sales:
(Quarterly Results - Jun 2025)
Net Profit:
stock-summaryTotal Returns
Total Returns (Price + Dividend) stock-summary
Dividend Yield (0%)
TimePeriod
Price Return
Dividend Return
Total Return
3 Months
-32.05%
0%
-32.05%
6 Months
-45.78%
0%
-45.78%
1 Year
-77.11%
0%
-77.11%
2 Years
-95.31%
0%
-95.31%
3 Years
-92.3%
0%
-92.3%
4 Years
-93.96%
0%
-93.96%
5 Years
0%
0%
0.0%

IGC Industries for the last several years.

Risk Adjusted Returns v/s stock-summary
Returns Beta
Icon
Beta has not been calculated since enough price history is not available
stock-summaryNews & Corporate Actions

News

Why is IGC Industries Ltd falling/rising?

Recent Price Movement and Market Comparison

IGC Industries Ltd closed at ₹2.25 on 13 January, down by ₹0.04 or 1.75% from the previous session. This decline is part of a broader negative trend, with the stock falling 5.46% over the past week and 15.41% in the last month. These losses significantly outpace the Sensex benchmark, which declined by 1.69% and 1.92% respectively over the same periods. Year-to-date, the stock has dropped 5.86%, again underperforming the Sensex’s 1.87% fall.

Over the longer term, the stock’s performance has been markedly poor. In the last year, IGC Industries has plummeted by 70.47%, while the Sensex has gained 9.56%. The three-year returns are even more stark, with the stock down 91.83% compared to the Sensex’s robust 38.78% rise. This sustai...

Read full news article
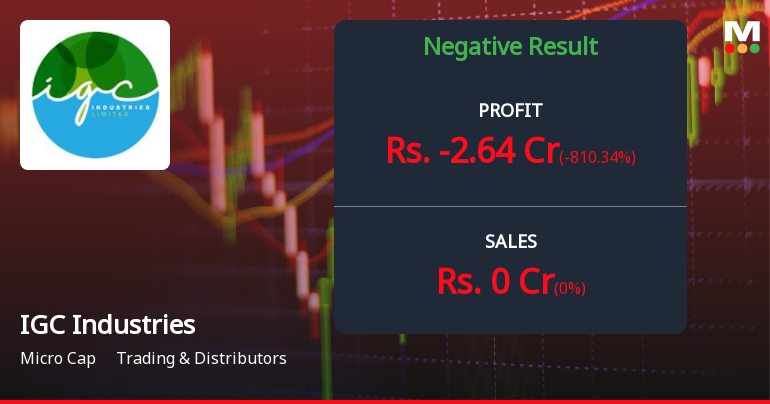
Announcements stock-summary

Compliances-Certificate under Reg. 74 (5) of SEBI (DP) Regulations 2018

09-Jan-2026 | Source : BSE

Compliances -Certificate under Reg.74(5) of SEBI (DP) Regulations 2018

Closure of Trading Window

29-Dec-2025 | Source : BSE

Closure of Trading Window

Un-Audited Financial Result For The Quarter Ended 30Th September 2025

14-Nov-2025 | Source : BSE

Un-Audited Financial Result for the Quarter Ended 30th September 2025

Corporate Actions stock-summary

stock-summary
BOARD MEETING

No Upcoming Board Meetings

stock-summary
DIVIDEND

No Dividend history available

stock-summary
SPLITS

No Splits history available

stock-summary
BONUS

No Bonus history available

stock-summary
RIGHTS

IGC Industries Ltd has announced 29:2 rights issue, ex-date: 18 Oct 24

stock-summaryKey Factors

Quality key factors stock-summary

Factor
Value
Sales Growth (5y)
0.00%
EBIT Growth (5y)
0.00%
EBIT to Interest (avg)
-0.19
Debt to EBITDA (avg)
10.79
Net Debt to Equity (avg)
0
Sales to Capital Employed (avg)
0.17
Tax Ratio
0
Dividend Payout Ratio
0
Pledged Shares
0
Institutional Holding
0.00%
ROCE (avg)
-2.92%
ROE (avg)
0.07%

Valuation key factors

Factor
Value
P/E Ratio
NA (Loss Making)
Industry P/E
12
Price to Book Value
0.18
EV to EBIT
-7.73
EV to EBITDA
-7.73
EV to Capital Employed
0.18
EV to Sales
3.88
PEG Ratio
NA
Dividend Yield
NA
ROCE (Latest)
-0.14%
ROE (Latest)
-0.14%

Technicals key factors

Indicator
Weekly
Monthly
MACD
Mildly Bullish
Bearish
RSI
Bullish
Bullish
Bollinger Bands
Bearish
Bearish
Moving Averages
Bearish (Daily)
KST
Bearish
Bearish
Dow Theory
No Trend
Bearish
stock-summary Technical Indicator Scale: Bearish, Mildly Bearish, Sideways, Mildly Bullish, Bullish  Turned 
stock-summaryShareholding
Shareholding Snapshot : Dec 2025stock-summary
Shareholding Compare (%holding) stock-summary
Majority shareholders

Non Institution

Pledged Promoter Holdings

None

Mutual Funds

Held by 0 Schemes

FIIs

Held by 0 FIIs

Promoter with highest holding

Disha Abhishek Mehta (0.0%)

Highest Public shareholder

Jr Seamless Private Limited (1.69%)

Individual Investors Holdings

93.88%

stock-summaryFinancial
[
  {
    "link": "quarterly",
    "btn_text": "All Quarterly Results",
    "header": "Quarterly Results Snapshot (Standalone) - Jun'25 - QoQ",
    "rhs": [
      {
        "prefix": "Net Sales ",
        "suffix": "QoQ Growth in quarter ended Jun 2025 is 0.00% vs 0.00% in Mar 2025",
        "dir": 0
      },
      {
        "prefix": "Standalone Net Profit ",
        "suffix": "QoQ Growth in quarter ended Jun 2025 is -100.00% vs 107.14% in Mar 2025",
        "dir": -1
      }
    ],
    "table": {
      "header": [
        "Jun'25",
        "Mar'25",
        "Change(%)"
      ],
      "body": [
        {
          "field": "Net Sales",
          "val1": "0.00",
          "val2": "0.00",
          "chgp": "",
          "chgp_class": "neutral"
        },
        {
          "field": "Operating Profit (PBDIT) excl Other Income",
          "val1": "0.00",
          "val2": "-0.05",
          "chgp": "100.00%",
          "chgp_class": "positive"
        },
        {
          "field": "Interest",
          "val1": "0.00",
          "val2": "0.00",
          "chgp": "",
          "chgp_class": "neutral"
        },
        {
          "field": "Exceptional Items",
          "val1": "0.00",
          "val2": "0.00",
          "chgp": "",
          "chgp_class": "neutral"
        },
        {
          "field": "Standalone Net Profit",
          "val1": "0.00",
          "val2": "0.02",
          "chgp": "-100.00%",
          "chgp_class": "negative"
        },
        {
          "field": "Operating Profit Margin (Excl OI)",
          "val1": "0.00%",
          "val2": "0.00%",
          "chgp": "NA",
          "chgp_class": "neutral"
        }
      ]
    }
  },
  {
    "link": "half-yearly",
    "btn_text": "All Half Yearly Results",
    "header": "Half Yearly Results Snapshot (Standalone) - Sep'25",
    "rhs": [
      {
        "prefix": "Net Sales ",
        "suffix": " Growth in half year ended Sep 2025 is -100.00% vs 0.00% in Sep 2024",
        "dir": -1
      },
      {
        "prefix": "Standalone Net Profit ",
        "suffix": " Growth in half year ended Sep 2025 is -100.00% vs 660.00% in Sep 2024",
        "dir": -1
      }
    ],
    "table": {
      "header": [
        "Sep'25",
        "Sep'24",
        "Change(%)"
      ],
      "body": [
        {
          "field": "Net Sales",
          "val1": "0.00",
          "val2": "1.99",
          "chgp": "-100.00%",
          "chgp_class": "negative"
        },
        {
          "field": "Operating Profit (PBDIT) excl Other Income",
          "val1": "0.00",
          "val2": "0.28",
          "chgp": "-100.00%",
          "chgp_class": "negative"
        },
        {
          "field": "Interest",
          "val1": "0.00",
          "val2": "0.00",
          "chgp": "",
          "chgp_class": "neutral"
        },
        {
          "field": "Exceptional Items",
          "val1": "0.00",
          "val2": "0.00",
          "chgp": "",
          "chgp_class": "neutral"
        },
        {
          "field": "Standalone Net Profit",
          "val1": "0.00",
          "val2": "0.28",
          "chgp": "-100.00%",
          "chgp_class": "negative"
        },
        {
          "field": "Operating Profit Margin (Excl OI)",
          "val1": "0.00%",
          "val2": "14.07%",
          "chgp": "-14.07%",
          "chgp_class": "negative"
        }
      ]
    }
  },
  {
    "link": "nine-monthly",
    "btn_text": "All Nine Monthly Results",
    "header": "Nine Monthly Results Snapshot (Standalone) - Jun'25",
    "rhs": [
      {
        "prefix": "Net Sales ",
        "suffix": "YoY Growth in nine months ended Jun 2025 is -100.00% vs 0.00% in Dec 2024",
        "dir": -1
      },
      {
        "prefix": "Standalone Net Profit ",
        "suffix": "YoY Growth in nine months ended Jun 2025 is 0.00% vs 100.00% in Dec 2024",
        "dir": -1
      }
    ],
    "table": {
      "header": [
        "Jun'25",
        "Dec'24",
        "Change(%)"
      ],
      "body": [
        {
          "field": "Net Sales",
          "val1": "0.00",
          "val2": "1.99",
          "chgp": "-100.00%",
          "chgp_class": "negative"
        },
        {
          "field": "Operating Profit (PBDIT) excl Other Income",
          "val1": "0.00",
          "val2": "0.00",
          "chgp": "",
          "chgp_class": "neutral"
        },
        {
          "field": "Interest",
          "val1": "0.00",
          "val2": "0.00",
          "chgp": "",
          "chgp_class": "neutral"
        },
        {
          "field": "Exceptional Items",
          "val1": "0.00",
          "val2": "0.00",
          "chgp": "",
          "chgp_class": "neutral"
        },
        {
          "field": "Standalone Net Profit",
          "val1": "0.00",
          "val2": "0.00",
          "chgp": "",
          "chgp_class": "neutral"
        },
        {
          "field": "Operating Profit Margin (Excl OI)",
          "val1": "0.00%",
          "val2": "-0.00%",
          "chgp": "NA",
          "chgp_class": "neutral"
        }
      ]
    }
  },
  {
    "link": "annual",
    "btn_text": "All Annual Results",
    "header": "Annual Results Snapshot (Standalone) - Mar'25",
    "rhs": [
      {
        "prefix": "Net Sales ",
        "suffix": "YoY Growth in year ended Mar 2025 is 0.00% vs 0.00% in Mar 2024",
        "dir": 0
      },
      {
        "prefix": "Standalone Net Profit ",
        "suffix": "YoY Growth in year ended Mar 2025 is 84.62% vs -116.67% in Mar 2024",
        "dir": 1
      }
    ],
    "table": {
      "header": [
        "Mar'25",
        "Mar'24",
        "Change(%)"
      ],
      "body": [
        {
          "field": "Net Sales",
          "val1": "1.99",
          "val2": "0.00",
          "chgp": "",
          "chgp_class": "neutral"
        },
        {
          "field": "Operating Profit (PBDIT) excl Other Income",
          "val1": "-0.06",
          "val2": "-0.39",
          "chgp": "84.62%",
          "chgp_class": "positive"
        },
        {
          "field": "Interest",
          "val1": "0.00",
          "val2": "0.00",
          "chgp": "",
          "chgp_class": "neutral"
        },
        {
          "field": "Exceptional Items",
          "val1": "0.00",
          "val2": "0.00",
          "chgp": "",
          "chgp_class": "neutral"
        },
        {
          "field": "Standalone Net Profit",
          "val1": "-0.06",
          "val2": "-0.39",
          "chgp": "84.62%",
          "chgp_class": "positive"
        },
        {
          "field": "Operating Profit Margin (Excl OI)",
          "val1": "-3.02%",
          "val2": "0.00%",
          "chgp": "-3.02%",
          "chgp_class": "negative"
        }
      ]
    }
  }
]

Quarterly Results Snapshot (Standalone) - Jun'25 - QoQstock-summary

Jun'25
Mar'25
Change(%)
Net Sales
0.00
0.00
Operating Profit (PBDIT) excl Other Income
0.00
-0.05
100.00%
Interest
0.00
0.00
Exceptional Items
0.00
0.00
Standalone Net Profit
0.00
0.02
-100.00%
Operating Profit Margin (Excl OI)
0.00%
0.00%
NA
Values in Rs Cr.
Net Sales

QoQ Growth in quarter ended Jun 2025 is 0.00% vs 0.00% in Mar 2025

Direction Arrows
Standalone Net Profit

QoQ Growth in quarter ended Jun 2025 is -100.00% vs 107.14% in Mar 2025

Half Yearly Results Snapshot (Standalone) - Sep'25stock-summary

Sep'25
Sep'24
Change(%)
Net Sales
0.00
1.99
-100.00%
Operating Profit (PBDIT) excl Other Income
0.00
0.28
-100.00%
Interest
0.00
0.00
Exceptional Items
0.00
0.00
Standalone Net Profit
0.00
0.28
-100.00%
Operating Profit Margin (Excl OI)
0.00%
14.07%
-14.07%
Values in Rs Cr.
Direction Arrows
Net Sales

Growth in half year ended Sep 2025 is -100.00% vs 0.00% in Sep 2024

Direction Arrows
Standalone Net Profit

Growth in half year ended Sep 2025 is -100.00% vs 660.00% in Sep 2024

Nine Monthly Results Snapshot (Standalone) - Jun'25stock-summary

Jun'25
Dec'24
Change(%)
Net Sales
0.00
1.99
-100.00%
Operating Profit (PBDIT) excl Other Income
0.00
0.00
Interest
0.00
0.00
Exceptional Items
0.00
0.00
Standalone Net Profit
0.00
0.00
Operating Profit Margin (Excl OI)
0.00%
-0.00%
NA
Values in Rs Cr.
Direction Arrows
Net Sales

YoY Growth in nine months ended Jun 2025 is -100.00% vs 0.00% in Dec 2024

Direction Arrows
Standalone Net Profit

YoY Growth in nine months ended Jun 2025 is 0.00% vs 100.00% in Dec 2024

Annual Results Snapshot (Standalone) - Mar'25stock-summary

Mar'25
Mar'24
Change(%)
Net Sales
1.99
0.00
Operating Profit (PBDIT) excl Other Income
-0.06
-0.39
84.62%
Interest
0.00
0.00
Exceptional Items
0.00
0.00
Standalone Net Profit
-0.06
-0.39
84.62%
Operating Profit Margin (Excl OI)
-3.02%
0.00%
-3.02%
Values in Rs Cr.
Net Sales

YoY Growth in year ended Mar 2025 is 0.00% vs 0.00% in Mar 2024

Direction Arrows
Standalone Net Profit

YoY Growth in year ended Mar 2025 is 84.62% vs -116.67% in Mar 2024

stock-summaryCompany CV
About IGC Industries Ltd stock-summary
stock-summary
IGC Industries Ltd
Micro Cap
Trading & Distributors
IGC Industries Limited was incorporated as `Maxwell Traders and Exporters Limited, pursuant to Certificate of Incorporation dated August 26, 1980 issued by the Registrar of Companies, West Bengal. The Company changed its name to `IGC Foils Limited' pursuant to a Fresh Certificate of Incorporation dated May 19, 1998 issued by the Registrar of Companies, West Bengal. The Company name was again changed from IGC Foils Limited to IGC Industries Limited in September, 2016.
Company Coordinates stock-summary
Company Details
Imax Lohia Square Office No 4B, 4th Flr Gangadhar Babu Lane Kolkata West Bengal : 700012
stock-summary
Tel: 91-22-28020017/18
stock-summary
igcfoils@gmail.com
Registrar Details
Satellite Corporate Services Pvt Ltd , B 302 Soni Apartment , Opp. St. Jude High School, Off. Andheri Kurla Road, Jarimari , Sakinaka, Mumbai