
Compare IHS Holding Ltd. with Similar Stocks
Dashboard
With a Negative Book Value, the company has a Weak Long Term Fundamental Strength
- Company's ability to service its debt is weak with a poor EBIT to Interest (avg) ratio of 1.30
- The company has reported losses and also has negative networth. This is not a good sign for the investors. Either company will have to raise fresh capital or report profits to sustain going forward
Risky - Negative Book Value
Stock DNA
Construction
USD 2,561 Million (Small Cap)
NA (Loss Making)
NA
0.00%
-20.05
-317.60%
-18.86
Total Returns (Price + Dividend) 
IHS Holding Ltd. for the last several years.
Risk Adjusted Returns v/s
News
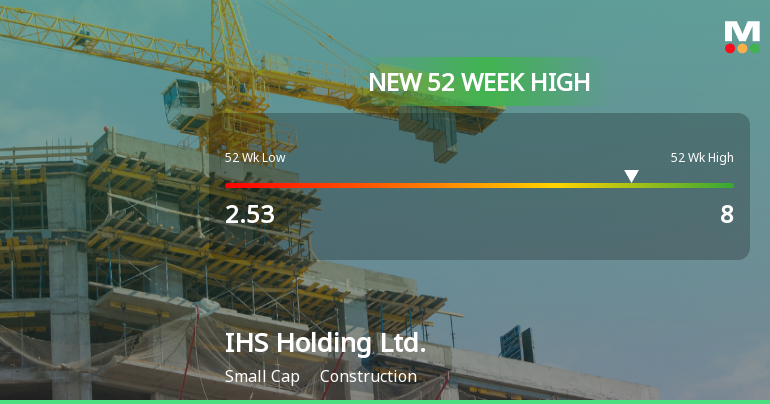
IHS Holding Hits New 52-Week High of $8.00, Up 90% Yearly
IHS Holding has achieved a new 52-week high of USD 8.00, reflecting a substantial one-year gain of 90.06%. As a small-cap construction company with a market capitalization of USD 2,461 million, it faces challenges, including ongoing losses and a negative return on equity, despite its recent stock performance.
Read full news article Announcements

Corporate Actions
Quality key factors
Valuation key factors
Technicals key factors
 Technical Indicator Scale: Bearish, Mildly Bearish, Sideways, Mildly Bullish, Bullish Turned
 Shareholding Snapshot : Sep 2025
Shareholding Compare (%holding)
Foreign Institutions
Held in 10 Schemes (1.02%)
Held by 34 Foreign Institutions (29.21%)
Quarterly Results Snapshot (Consolidated) - Sep'25 - QoQ

QoQ Growth in quarter ended Sep 2025 is 5.03% vs -1.43% in Jun 2025
QoQ Growth in quarter ended Sep 2025 is 356.35% vs 5.21% in Jun 2025
Annual Results Snapshot (Consolidated) - Dec'24

YoY Growth in year ended Dec 2024 is -19.49% vs 8.37% in Dec 2023
YoY Growth in year ended Dec 2024 is 17.30% vs -323.92% in Dec 2023
About IHS Holding Ltd.

Company Coordinates


