
Compare IIFL Capital with Similar Stocks
Stock DNA
Capital Markets
INR 10,757 Cr (Small Cap)
19.00
20
0.87%
0.59
18.31%
3.51
Total Returns (Price + Dividend) 
Latest dividend: 3 per share ex-dividend date: Feb-16-2026
Risk Adjusted Returns v/s
Returns Beta

News

IIFL Capital Services Ltd Technical Momentum Shifts Amid Mixed Market Signals
IIFL Capital Services Ltd, a small-cap player in the capital markets sector, has experienced a nuanced shift in its technical momentum, moving from a mildly bearish stance to a sideways trend. Despite a modest day gain of 1.56%, the stock’s technical indicators present a complex picture, with bullish signals on weekly charts contrasting with mildly bearish monthly trends. This article analyses the recent price action, technical indicator signals, and the implications for investors amid a challenging market backdrop.
Read full news article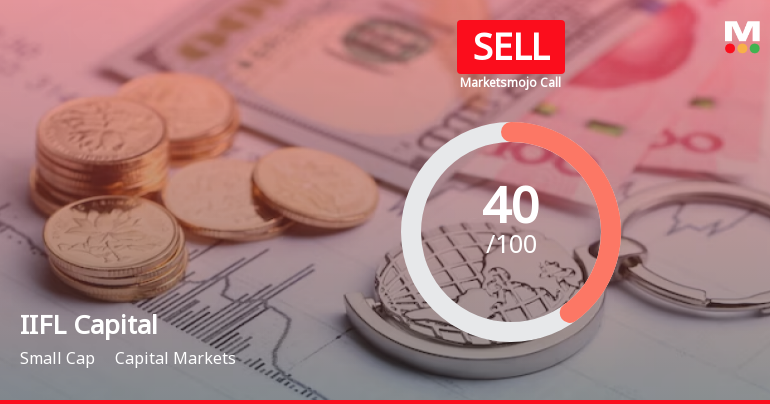
IIFL Capital Services Ltd is Rated Sell
IIFL Capital Services Ltd is rated 'Sell' by MarketsMOJO, with this rating last updated on 27 May 2026. However, the analysis and financial metrics discussed below reflect the stock’s current position as of 08 June 2026, providing investors with an up-to-date view of the company’s fundamentals, valuation, financial trend, and technical outlook.
Read full news article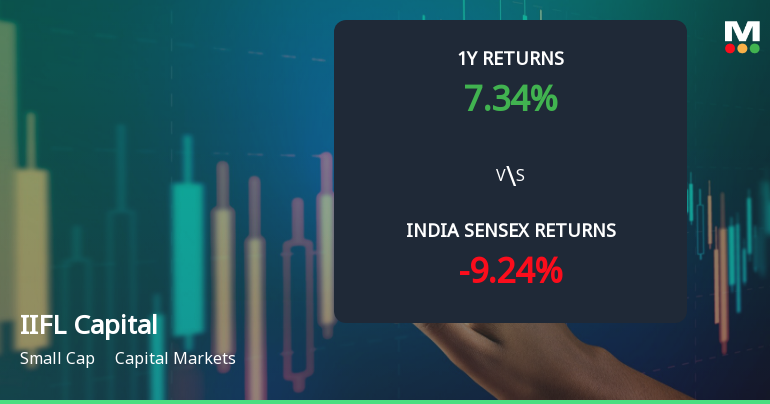
IIFL Capital Services Ltd Technical Momentum Shifts Amid Mixed Indicator Signals
IIFL Capital Services Ltd has experienced a subtle but notable shift in its technical momentum, moving from a sideways trend to a mildly bearish stance. Despite some bullish weekly indicators, monthly signals suggest caution for investors as the stock navigates a complex technical landscape amid fluctuating market conditions.
Read full news article Announcements
Shareholder Meeting / Postal Ballot-Scrutinizers Report
03-Jun-2026 | Source : BSEVoting results and Scrutinizers report for the Extra -Ordinary General Meeting held on June 01 2026
Shareholder Meeting / Postal Ballot-Outcome of EGM
01-Jun-2026 | Source : BSEProceedings of the Extra-Ordinary General Meeting of the Company held on June 01 2026
Compliances-Reg.24(A)-Annual Secretarial Compliance
30-May-2026 | Source : BSEAnnual Secretarial Compliance Report for the Financial Year ended March 31 2026
Corporate Actions

No Upcoming Board Meetings

IIFL Capital Services Ltd has declared 150% dividend, ex-date: 16 Feb 26

No Splits history available

No Bonus history available

No Rights history available
Quality key factors
Valuation key factors
Technicals key factors
 Technical Indicator Scale: Bearish, Mildly Bearish, Sideways, Mildly Bullish, Bullish Turned
 Shareholding Snapshot : Mar 2026
Shareholding Compare (%holding)
Non Institution
None
Held by 8 Schemes (1.22%)
Held by 130 FIIs (16.33%)
Nirmal Bhanwarlal Jain (15.08%)
Fih Mauritius Investments Ltd (27.18%)
12.98%
Quarterly Results Snapshot (Consolidated) - Mar'26 - QoQ

QoQ Growth in quarter ended Mar 2026 is 9.90% vs 2.48% in Dec 2025

QoQ Growth in quarter ended Mar 2026 is -38.60% vs 121.38% in Dec 2025
Half Yearly Results Snapshot (Consolidated) - Sep'25
Growth in half year ended Sep 2025 is -7.46% vs 40.31% in Sep 2024
Growth in half year ended Sep 2025 is -32.93% vs 112.18% in Sep 2024
Nine Monthly Results Snapshot (Consolidated) - Dec'25
YoY Growth in nine months ended Dec 2025 is -4.93% vs 26.65% in Dec 2024
YoY Growth in nine months ended Dec 2025 is -23.58% vs 75.77% in Dec 2024
Annual Results Snapshot (Consolidated) - Mar'26
YoY Growth in year ended Mar 2026 is 0.62% vs 11.28% in Mar 2025
YoY Growth in year ended Mar 2026 is -21.20% vs 39.04% in Mar 2025
About IIFL Capital Services Ltd

Company Coordinates


