
Compare IITL Projects with Similar Stocks
Dashboard
With a Negative Book Value, the company has a Weak Long Term Fundamental Strength
- Poor long term growth as Net Sales has grown by an annual rate of -10.95% and Operating profit at 0% over the last 5 years
- The company has a negative book value of Rs 35.59 crore
Flat results in Jun 25
Risky - Negative Book Value
Underperformed the market in the last 1 year
Total Returns (Price + Dividend) 
IITL Projects for the last several years.
Risk Adjusted Returns v/s
Returns Beta

News
When is the next results date for IITL Projects Ltd?
The next results date for IITL Projects Ltd is scheduled for 22 May 2026....
Read full news article
IITL Projects Ltd Falls to 52-Week Low of Rs 33.01 as Sell-Off Deepens
A sharp decline of 13.09% intraday dragged IITL Projects Ltd to a fresh 52-week low of Rs 33.01 on 23 Apr 2026, marking a significant setback for the micro-cap realty firm amid broader market volatility.
Read full news article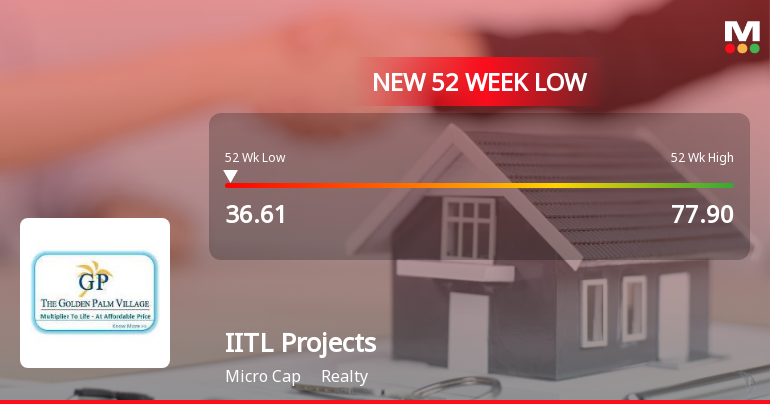
IITL Projects Ltd Falls to 52-Week Low of Rs 35 as Sell-Off Deepens
For the fifth consecutive session, IITL Projects Ltd closed lower, hitting a fresh 52-week low of Rs 35 on 22 Apr 2026, marking a 6.49% intraday decline and underperforming its sector by 6.67%. This latest drop extends the stock’s year-long slide of 38.51%, starkly contrasting with the Sensex’s modest 1.14% loss over the same period.
Read full news article Announcements
Closure of Trading Window
08-Jun-2026 | Source : BSEIntimation for withdrawal of Closure of Trading Window - Further to intimation dated 27.05.2026 regarding closure of trading window for dealing in securities of the Company pursuant to SEBI(PIT) Regulations 2015 and the Companys Code of conduct for prohibition of Insider trading in its securities the Company had intimated that the Trading window will be closed for all Connected / Designated persons of the Company w.e.f. start of trading hours of 28.05.2026 extending until the conclusion of 30.06.2026. We hereby inform you that the Company has decided to discontinue with the ongoing assessments within the Company concerning a potential corporate initiative. Accordingly the Closure of Trading Window for dealing in the securities of the Company no longer exist. Hence the Trading Window for dealing in the securities of the Company shall remain open for all designated persons and their immediate relatives with immediate effect.
Closure of Trading Window
27-May-2026 | Source : BSEIntimation of Closure of Trading Window
Announcement under Regulation 30 (LODR)-Newspaper Publication
25-May-2026 | Source : BSEPlease find enclosed copies of Newspaper Advertisement of the Audited Standalone Financial Results of the Company for the quarter and Financial year ended March 31 2026 published in The Free Press Journal (English) and Navshakti (Marathi) newspapers on May 24 2026.
Corporate Actions

No Upcoming Board Meetings

No Dividend history available

No Splits history available

No Bonus history available

No Rights history available
Quality key factors
Valuation key factors
Technicals key factors
 Technical Indicator Scale: Bearish, Mildly Bearish, Sideways, Mildly Bullish, Bullish Turned
 Shareholding Snapshot : Mar 2026
Shareholding Compare (%holding)
Promoters
None
Held by 0 Schemes
Held by 0 FIIs
Industrial Investment Trust Ltd. (71.74%)
Prashant M Dakle (3.9%)
24.05%
Quarterly Results Snapshot (Standalone) - Mar'26 - YoY

YoY Growth in quarter ended Mar 2026 is 100.00% vs -137.04% in Mar 2025

YoY Growth in quarter ended Mar 2026 is -99.46% vs 613.24% in Mar 2025
Half Yearly Results Snapshot (Standalone) - Sep'25
Growth in half year ended Sep 2025 is -100.00% vs -54.95% in Sep 2024
Growth in half year ended Sep 2025 is 117.95% vs 29.94% in Sep 2024
Nine Monthly Results Snapshot (Standalone) - Dec'25
YoY Growth in nine months ended Dec 2025 is -100.00% vs -70.41% in Dec 2024
YoY Growth in nine months ended Dec 2025 is 129.86% vs -120.16% in Dec 2024
Annual Results Snapshot (Standalone) - Mar'26
YoY Growth in year ended Mar 2026 is -100.00% vs -91.60% in Mar 2025
YoY Growth in year ended Mar 2026 is -96.03% vs 39.80% in Mar 2025
About IITL Projects Ltd

Company Coordinates


