
Compare IL&FS Engg. with Similar Stocks
Dashboard
With a Negative Book Value, the company has a Weak Long Term Fundamental Strength
- Poor long term growth as Net Sales has grown by an annual rate of -10.80% and Operating profit at 0% over the last 5 years
- The company has a negative book value of Rs 3,189.88 crore
Flat results in Mar 26
Risky - Negative EBITDA
Underperformed the market in the last 1 year
Total Returns (Price + Dividend) 
Latest dividend: 1.5 per share ex-dividend date: Sep-19-2008
Risk Adjusted Returns v/s
Returns Beta

News
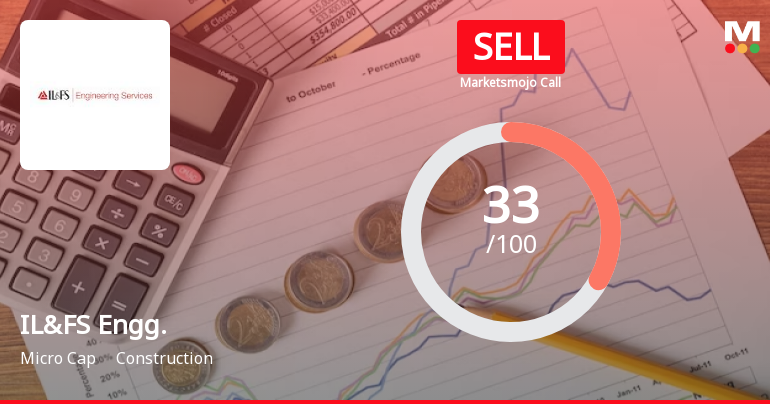
IL&FS Engineering & Construction Co Ltd is Rated Sell
IL&FS Engineering & Construction Co Ltd is rated 'Sell' by MarketsMOJO, with this rating last updated on 15 June 2026. However, the analysis and financial metrics discussed here reflect the stock's current position as of 08 July 2026, providing investors with an up-to-date view of the company’s fundamentals, returns, and market standing.
Read full news article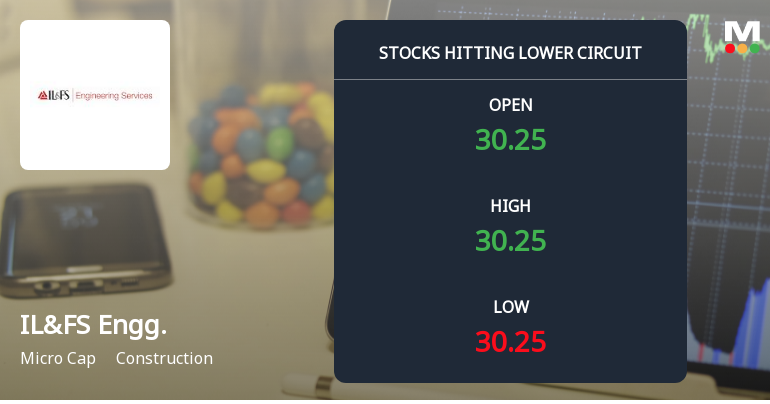
IL&FS Engineering & Construction Co Ltd Locks at Lower Circuit With 5% Loss — Sellers Queue, No Buyers in Sight
At Rs 28.50, sellers were still queuing — but there were no buyers willing to take the other side. IL&FS Engineering & Construction Co Ltd locked at its lower circuit of 5% on 6 Jul 2026, with unfilled sell orders and a frozen price.
Read full news article
IL&FS Engineering & Construction Co Ltd is Rated Sell
IL&FS Engineering & Construction Co Ltd is rated 'Sell' by MarketsMOJO, with this rating last updated on 15 June 2026. However, the analysis and financial metrics presented here reflect the stock's current position as of 27 June 2026, providing investors with the most up-to-date view of the company’s fundamentals, returns, and market performance.
Read full news article Announcements
Letter To Shareholders
13-Jul-2026 | Source : BSELetter to Shareholders not having Email Ids
Board Meeting Intimation for Board Meeting
09-Jul-2026 | Source : BSEIL&FS Engineering And Construction Company Ltdhas informed BSE that the meeting of the Board of Directors of the Company is scheduled on 31/07/2026 inter alia to consider and approve Board Meeting for Q1 FY 206-27
Compliances-Certificate under Reg. 74 (5) of SEBI (DP) Regulations 2018
08-Jul-2026 | Source : BSESubmission of confirmation under Regulation 74(5) of SEBI DP Regulations
Corporate Actions

31 Jul 2026

IL&FS Engineering & Construction Co Ltd has declared 15% dividend, ex-date: 19 Sep 08

No Splits history available

No Bonus history available

No Rights history available
Quality key factors
Valuation key factors
Technicals key factors
 Technical Indicator Scale: Bearish, Mildly Bearish, Sideways, Mildly Bullish, Bullish Turned
 Shareholding Snapshot : Jun 2026
Shareholding Compare (%holding)
Non Institution
None
Held by 0 Schemes
Held by 5 FIIs (0.7%)
Il&fs Financial Services Limited (21.29%)
Sbg Projects Investments Limited (27.87%)
15.88%
Quarterly Results Snapshot (Consolidated) - Mar'26 - QoQ

QoQ Growth in quarter ended Mar 2026 is -52.20% vs 14.36% in Dec 2025

QoQ Growth in quarter ended Mar 2026 is 466.85% vs 241.27% in Dec 2025
Half Yearly Results Snapshot (Consolidated) - Sep'25
Growth in half year ended Sep 2025 is -36.76% vs 19.34% in Sep 2024
Growth in half year ended Sep 2025 is 23.16% vs -204.41% in Sep 2024
Nine Monthly Results Snapshot (Consolidated) - Dec'25
YoY Growth in nine months ended Dec 2025 is -27.91% vs 26.13% in Dec 2024
YoY Growth in nine months ended Dec 2025 is 28.35% vs -158.73% in Dec 2024
Annual Results Snapshot (Consolidated) - Mar'26
YoY Growth in year ended Mar 2026 is -41.53% vs 24.31% in Mar 2025
YoY Growth in year ended Mar 2026 is 127.25% vs 93.70% in Mar 2025
About IL&FS Engineering & Construction Co Ltd

Company Coordinates


