
Compare IL&FS Engg. with Similar Stocks
Dashboard
With a Negative Book Value, the company has a Weak Long Term Fundamental Strength
- Poor long term growth as Net Sales has grown by an annual rate of -10.80% and Operating profit at 0% over the last 5 years
- The company has a negative book value of Rs 3,189.88 crore
Flat results in Mar 26
Risky - Negative EBITDA
Underperformed the market in the last 1 year
Total Returns (Price + Dividend) 
Latest dividend: 1.5 per share ex-dividend date: Sep-19-2008
Risk Adjusted Returns v/s
Returns Beta

News
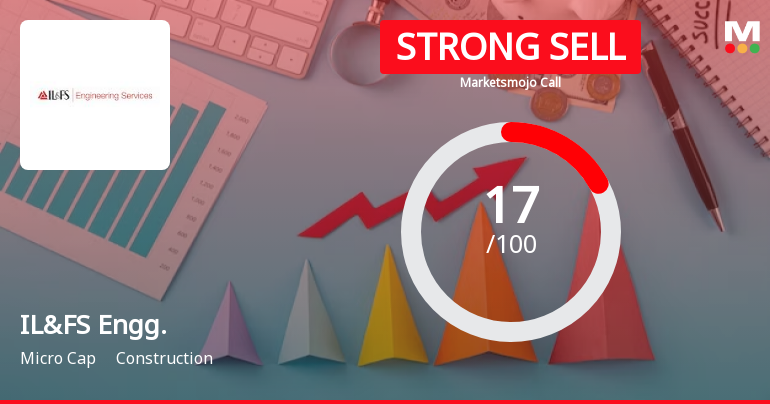
IL&FS Engineering & Construction Co Ltd is Rated Strong Sell
IL&FS Engineering & Construction Co Ltd is rated Strong Sell by MarketsMOJO. This rating was last updated on 01 April 2025. However, the analysis and financial metrics discussed below reflect the company’s current position as of 10 June 2026, providing investors with the latest insights into its performance and outlook.
Read full news article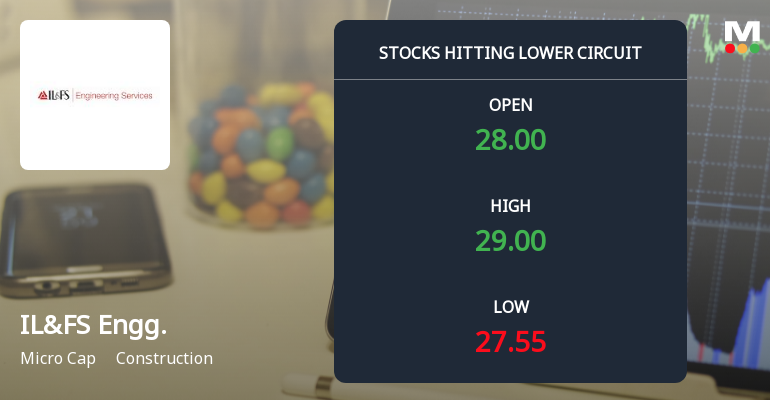
IL&FS Engineering & Construction Co Ltd Locks at Lower Circuit With 4.97% Loss — Sellers Queue, No Buyers in Sight
At Rs 26.41, sellers were still queuing — but there were no buyers willing to take the other side. IL&FS Engineering & Construction Co Ltd locked at its lower circuit of 4.97% on 3 Jun 2026, with unfilled sell orders and a frozen price, reflecting persistent selling pressure in a micro-cap stock with limited liquidity.
Read full news article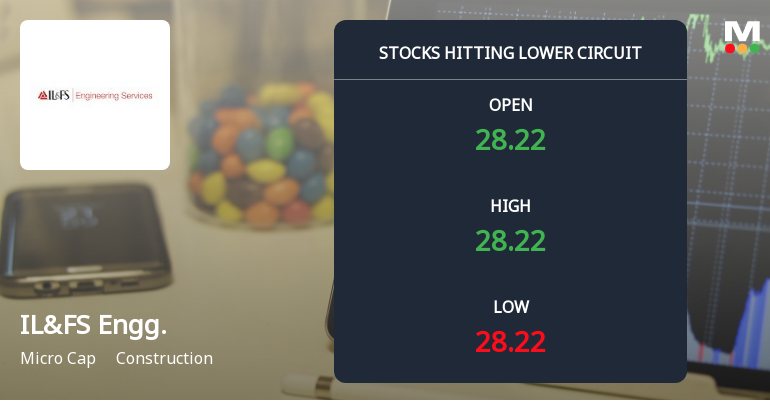
IL&FS Engineering & Construction Co Ltd Locks at Lower Circuit With 4.99% Loss — Sellers Queue, No Buyers in Sight
At Rs 27.79, sellers were still queuing — but there were no buyers willing to take the other side. IL&FS Engineering & Construction Co Ltd locked at its lower circuit of 4.99% on 2 Jun 2026, with unfilled sell orders and a frozen price that capped losses for the day.
Read full news article Announcements
General Update As Per Regulation 30 Of SEBI LODR Regulations
04-Jun-2026 | Source : BSEReceipt of Letter of Award wrt. an EPC sub-contract pertaining to Jaipur Metro Phase-II Project
Announcement under Regulation 30 (LODR)-Newspaper Publication
29-May-2026 | Source : BSEPublication of Newspaper announcement of audited financial results for FY 26
Compliances-Reg.24(A)-Annual Secretarial Compliance
29-May-2026 | Source : BSESubmission of Annual Secretarial Compliance Report for FY 2025-26
Corporate Actions

No Upcoming Board Meetings

IL&FS Engineering & Construction Co Ltd has declared 15% dividend, ex-date: 19 Sep 08

No Splits history available

No Bonus history available

No Rights history available
Quality key factors
Valuation key factors
Technicals key factors
 Technical Indicator Scale: Bearish, Mildly Bearish, Sideways, Mildly Bullish, Bullish Turned
 Shareholding Snapshot : Mar 2026
Shareholding Compare (%holding)
Non Institution
None
Held by 0 Schemes
Held by 5 FIIs (0.7%)
Il&fs Financial Services Limited (21.29%)
Sbg Projects Investments Limited (27.87%)
16.1%
Quarterly Results Snapshot (Consolidated) - Mar'26 - QoQ

QoQ Growth in quarter ended Mar 2026 is -52.20% vs 14.36% in Dec 2025

QoQ Growth in quarter ended Mar 2026 is 466.85% vs 241.27% in Dec 2025
Half Yearly Results Snapshot (Consolidated) - Sep'25
Growth in half year ended Sep 2025 is -36.76% vs 19.34% in Sep 2024
Growth in half year ended Sep 2025 is 23.16% vs -204.41% in Sep 2024
Nine Monthly Results Snapshot (Consolidated) - Dec'25
YoY Growth in nine months ended Dec 2025 is -27.91% vs 26.13% in Dec 2024
YoY Growth in nine months ended Dec 2025 is 28.35% vs -158.73% in Dec 2024
Annual Results Snapshot (Consolidated) - Mar'26
YoY Growth in year ended Mar 2026 is -41.53% vs 24.31% in Mar 2025
YoY Growth in year ended Mar 2026 is 127.25% vs 93.70% in Mar 2025
About IL&FS Engineering & Construction Co Ltd

Company Coordinates


