
Compare IL&FS Inv.Manag. with Similar Stocks
Dashboard
With a Operating Losses, the company has a Weak Long Term Fundamental Strength
- Poor long term growth as Net Sales has grown by an annual rate of -100.00%
The company has declared positive results in Mar'2025 after 2 consecutive negative quarters
With ROE of 8, it has a Very Attractive valuation with a 1.4 Price to Book Value
100% of Promoter Shares are Pledged
Total Returns (Price + Dividend) 
Latest dividend: 0.5029550827423167 per share ex-dividend date: Nov-21-2025
Risk Adjusted Returns v/s
Returns Beta

News
IL&FS Investment Managers Ltd Upgraded to Hold on Technical and Financial Improvements
IL&FS Investment Managers Ltd has seen its investment rating upgraded from Sell to Hold, reflecting a notable improvement in technical indicators and a strong quarterly financial performance. Despite lingering concerns over long-term fundamentals and promoter share pledging, the company’s valuation and recent profit growth have contributed to a more favourable outlook among analysts.
Read full news article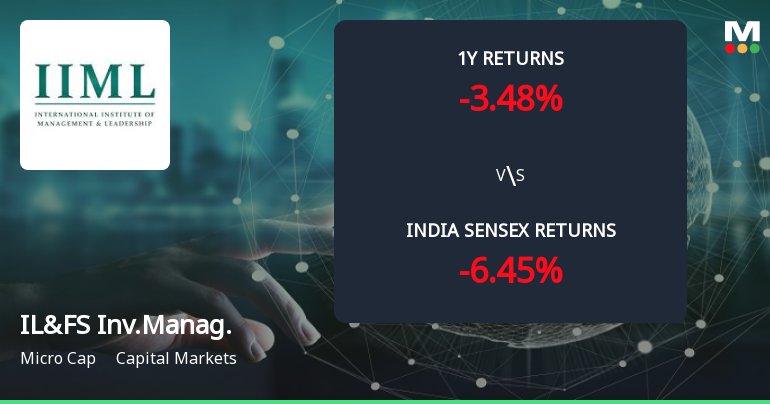
Golden Cross Forms in IL&FS Investment Managers Ltd — On a Day the Stock Gained 0.82%. What the Mixed Signals Mean
The 50-day moving average has crossed above the 200-day moving average for IL&FS Investment Managers Ltd, signalling a golden cross on 22 Jun 2026. Yet, the stock’s modest 0.82% gain on the day and a mixed technical backdrop suggest the signal requires careful interpretation rather than blind optimism.
Read full news article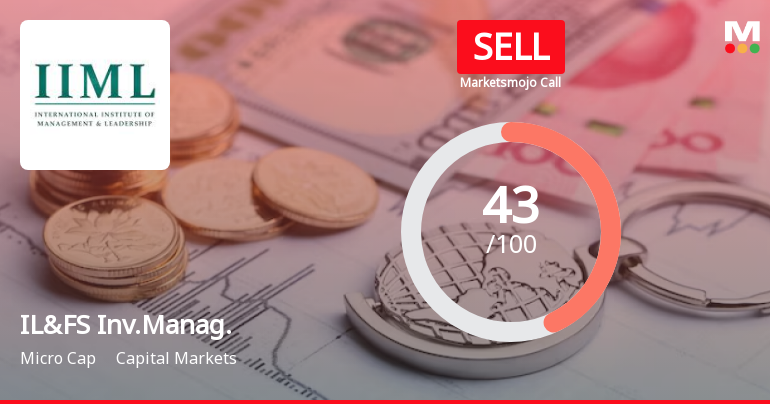
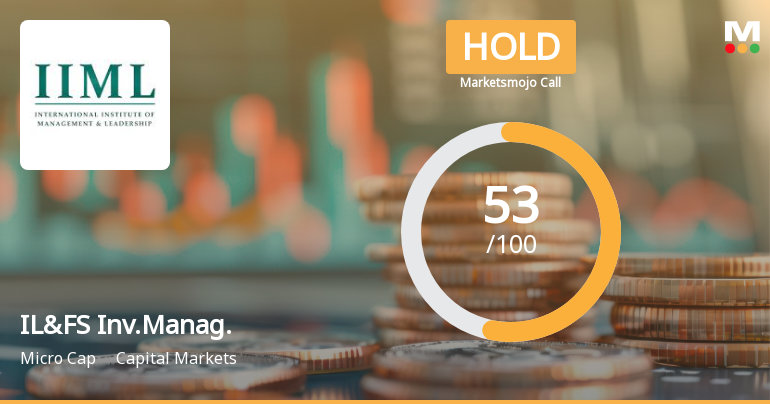
IL&FS Investment Managers Ltd is Rated Sell
IL&FS Investment Managers Ltd is rated 'Sell' by MarketsMOJO, with this rating last updated on 04 Aug 2025. However, the analysis and financial metrics discussed here reflect the stock's current position as of 22 June 2026, providing investors with an up-to-date view of its fundamentals, valuation, financial trends, and technical standing.
Read full news article Announcements
Board Meeting Outcome for Audited Consolidated Financial Statements/Financial Results For The Quarter And Financial Year Ended March 31 2026
30-May-2026 | Source : BSEThe Board of Directors of IL&FS Investment Managers Limited (the Company) at its meeting held today i.e. May 30 2026 inter alia approved the Audited Consolidated Financial Statements/Financial Results for the quarter and financial year ended March 31 2026 as recommended by the Audit Committee. Please find enclosed a copy of the said Financial Statements/ Results along with the Auditors Report with modified opinion on the aforesaid Audited Consolidated Financial Statements/ Results.
Compliances-Reg.24(A)-Annual Secretarial Compliance
30-May-2026 | Source : BSEAnnual Secretarial Compliance Report for the period ended March 31 2026
Board Meeting Outcome for Outcome Of Board Meeting Dated 29-05-2026
29-May-2026 | Source : BSE1. Approved the Audited Standalone Financial Statements/ Results for the quarter and financial year ended March 31 2026 2. Noted that the Audited Consolidated Financial Statements/Financial Results for the quarter and financial year ended March 31 2026 could not be finalized and considered due to non-receipt of the Audited Financial Statements/Audit Report of one of the Subsidiaries viz. IL&FS Investment Advisors LLC and its step down Subsidiary viz. Saffron Investment Trust. Accordingly the Audit Committee and the Board of Directors shall consider and approve the Audited Consolidated Financial Statements/Financial Results at a separate meeting proposed to be convened on Saturday May 30 2026 3. Recommended a Dividend of ?0.70 per equity share of face value ?2 each for the financial year March 31 2026 subject to the approval of the shareholders at the ensuing Annual General Meeting of the Company
Corporate Actions

No Upcoming Board Meetings

IL&FS Investment Managers Ltd has declared 25% dividend, ex-date: 21 Nov 25

IL&FS Investment Managers Ltd has announced 2:10 stock split, ex-date: 16 Sep 09

IL&FS Investment Managers Ltd has announced 1:2 bonus issue, ex-date: 26 Dec 13

No Rights history available
Quality key factors
Valuation key factors
Technicals key factors
 Technical Indicator Scale: Bearish, Mildly Bearish, Sideways, Mildly Bullish, Bullish Turned
 Shareholding Snapshot : Mar 2026
Shareholding Compare (%holding)
Promoters
100
Held by 1 Schemes (0.0%)
Held by 0 FIIs
Infrastructure Leasing And Financial Servicesltd (50.42%)
None
43.39%
Quarterly Results Snapshot (Standalone) - Mar'26 - QoQ
QoQ Growth in quarter ended Mar 2026 is 0.00% vs 0.00% in Dec 2025

QoQ Growth in quarter ended Mar 2026 is 1,478.62% vs -105.72% in Dec 2025
Half Yearly Results Snapshot (Standalone) - Sep'25

Growth in half year ended Sep 2025 is -100.00% vs -11.76% in Sep 2024
Growth in half year ended Sep 2025 is 750.71% vs -802.13% in Sep 2024
Nine Monthly Results Snapshot (Standalone) - Dec'25
YoY Growth in nine months ended Dec 2025 is -100.00% vs -41.86% in Dec 2024
YoY Growth in nine months ended Dec 2025 is 1,018.73% vs -38.05% in Dec 2024
Annual Results Snapshot (Standalone) - Mar'26
YoY Growth in year ended Mar 2026 is -100.00% vs -51.92% in Mar 2025
YoY Growth in year ended Mar 2026 is 2,297.71% vs -109.68% in Mar 2025
About IL&FS Investment Managers Ltd

Company Coordinates


