
Compare Impex Ferro Tech with Similar Stocks
Dashboard
With a Negative Book Value, the company has a Weak Long Term Fundamental Strength
- Poor long term growth as Net Sales has grown by an annual rate of -100.00% and Operating profit at 0% over the last 5 years
- The company has a negative book value of Rs 321.64 crore
Flat results in Mar 26
Risky - Negative EBITDA
Stock DNA
Ferrous Metals
INR 22 Cr (Micro Cap)
NA (Loss Making)
21
0.00%
-0.83
2.00%
-0.07
Total Returns (Price + Dividend) 
Impex Ferro Tech for the last several years.
Risk Adjusted Returns v/s
Returns Beta

News

Impex Ferro Tech Ltd Locks at Upper Circuit With 4.96% Gain — Buyers Queue, Sellers Absent
At Rs 2.54, the buying was done — not because demand dried up, but because the exchange wouldn't let the stock go any higher. Impex Ferro Tech Ltd locked at its upper circuit of 4.96% on 09 Jun 2026, with buyers queuing and no sellers willing to part with shares.
Read full news article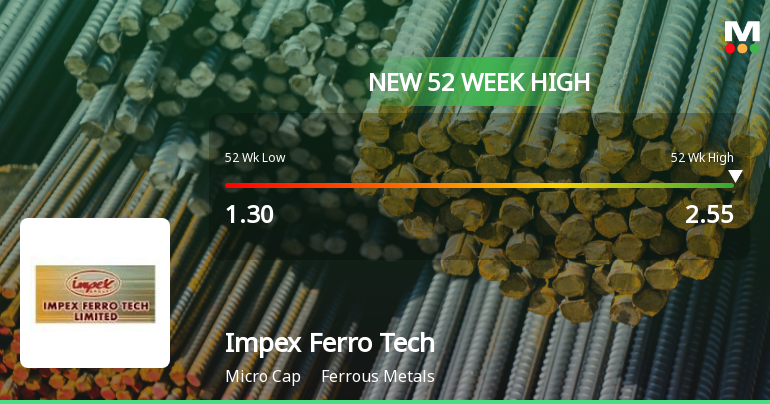
Broad-Based Technical Strength Lifts Impex Ferro Tech Ltd to 52-Week High of Rs 2.55
Surging past its previous peaks, Impex Ferro Tech Ltd touched a fresh 52-week high of Rs 2.55 on 09 Jun 2026, marking a significant milestone in its price journey. This rally has been fuelled by a confluence of strong technical signals and sustained momentum, even as the broader market remains subdued.
Read full news article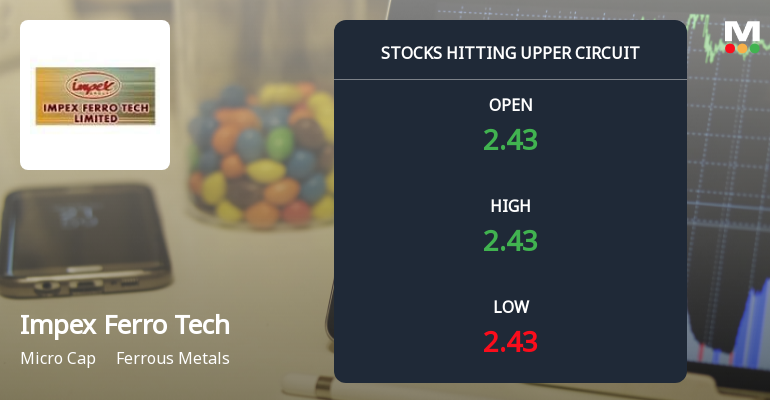
Impex Ferro Tech Ltd Locks at Upper Circuit With 4.76% Gain — Buyers Queue, Sellers Absent
At Rs 2.42, the buying was done — not because demand dried up, but because the exchange wouldn't let the stock go any higher. Impex Ferro Tech Ltd locked at its upper circuit of 4.76% on 8 Jun 2026, with buyers queuing and no sellers willing to part with shares.
Read full news article Announcements
Corporate Insolvency Resolution Process (CIRP)-Outcome of meeting of Committee of Creditors
01-Jun-2026 | Source : BSEOutcome of 26th CoC
FR March 2026
30-May-2026 | Source : BSEQFR March 2026
Corporate Insolvency Resolution Process (CIRP)-Intimation of meeting of Committee of Creditors
27-May-2026 | Source : BSEIntimation of 26th CoC Meeting
Corporate Actions

No Upcoming Board Meetings

No Dividend history available

No Splits history available

No Bonus history available

Impex Ferro Tech Ltd has announced 1:1 rights issue, ex-date: 17 Sep 09
Quality key factors
Valuation key factors
Technicals key factors
 Technical Indicator Scale: Bearish, Mildly Bearish, Sideways, Mildly Bullish, Bullish Turned
 Shareholding Snapshot : Mar 2025
Shareholding Compare (%holding)
Promoters
100
Held by 0 Schemes
Held by 0 FIIs
Suanvi Trading & Investment Company Pvt.ltd (17.14%)
None
27.2%
Quarterly Results Snapshot (Standalone) - Mar'26 - QoQ
QoQ Growth in quarter ended Mar 2026 is 0.00% vs 0.00% in Dec 2025

QoQ Growth in quarter ended Mar 2026 is 48.07% vs 0.00% in Dec 2025
Half Yearly Results Snapshot (Standalone) - Sep'25

Growth in half year ended Sep 2025 is -100.00% vs -91.57% in Sep 2024
Growth in half year ended Sep 2025 is -7.60% vs 41.44% in Sep 2024
Nine Monthly Results Snapshot (Standalone) - Dec'25
YoY Growth in nine months ended Dec 2025 is -100.00% vs -93.09% in Dec 2024
YoY Growth in nine months ended Dec 2025 is -4.57% vs 43.97% in Dec 2024
Annual Results Snapshot (Standalone) - Mar'26
YoY Growth in year ended Mar 2026 is -100.00% vs -99.24% in Mar 2025
YoY Growth in year ended Mar 2026 is 9.05% vs 76.30% in Mar 2025
About Impex Ferro Tech Ltd

Company Coordinates


