
Compare Inani Securities with Similar Stocks
Dashboard
With a Operating Losses, the company has a Weak Long Term Fundamental Strength
- Poor long term growth as Net Sales has grown by an annual rate of -14.97% and Operating profit at -21.11%
Flat results in Mar 26
With ROE of 0.4, it has a Very Expensive valuation with a 0.5 Price to Book Value
Below par performance in long term as well as near term
Stock DNA
Non Banking Financial Company (NBFC)
INR 10 Cr (Micro Cap)
137.00
20
0.00%
0.05
0.36%
0.50
Total Returns (Price + Dividend) 
Latest dividend: 1.0000 per share ex-dividend date: Sep-24-2008
Risk Adjusted Returns v/s
Returns Beta

News
Are Inani Securities Ltd latest results good or bad?
Inani Securities Ltd's latest financial results for the quarter ending March 2026 reveal significant challenges in profitability despite a quarter-on-quarter revenue growth of 11.11%. The company reported revenue of ₹0.30 crores, which reflects a year-on-year decline of 6.25% from ₹0.32 crores in the same quarter last year. This indicates ongoing difficulties in maintaining consistent revenue growth. The net profit for the quarter was effectively zero (₹0.00 crores), marking a substantial decline from ₹0.02 crores in the previous quarter. This represents the weakest quarterly profit performance in the available data series. The operating profit margin, excluding other income, remained negative at -6.67%, although it showed some improvement from -29.63% in the preceding quarter. Operationally, the company continues to face structural weaknesses, as evidenced by a return on equity (ROE) of 2.13%, which is s...
Read full news article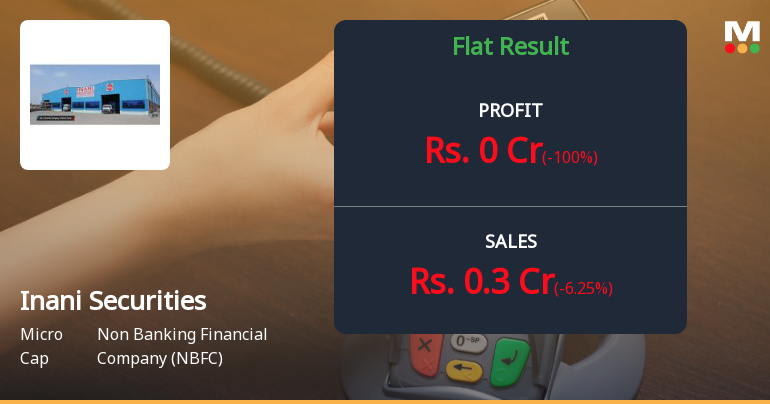
Inani Securities Q4 FY26: Negligible Profits Amid Operational Struggles
Inani Securities Ltd., a micro-cap non-banking financial company with a market capitalisation of ₹10.00 crores, reported virtually flat performance in Q4 FY26, posting net profit of just ₹0.00 crores on revenue of ₹0.30 crores. The Hyderabad-based firm, trading at ₹21.82 as of May 29, 2026, continues to grapple with operational losses and structural challenges that have plagued its performance throughout the fiscal year.
Read full news article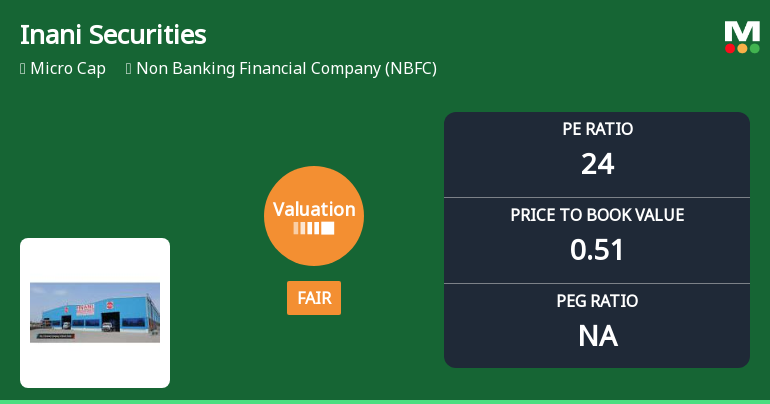
Inani Securities Ltd Valuation Shifts to Fair Amid Market Pressure
Inani Securities Ltd, a micro-cap player in the Non Banking Financial Company (NBFC) sector, has witnessed a notable shift in its valuation parameters, moving from an expensive to a fair valuation grade. This transition comes amid a challenging market environment, reflected in the stock’s recent price decline and deteriorating financial metrics, prompting a downgrade in its Mojo Grade to Strong Sell.
Read full news article Announcements
Compliances-Reg.24(A)-Annual Secretarial Compliance
04-Jun-2026 | Source : BSECompliance-Regulation 24-(A)- Annual Secretarial Compliance
Board Meeting Outcome for FINANCIAL RESULT FOR 4TH QUARTER AND YEAR ENDED 31.03.2026
29-May-2026 | Source : BSEFINANCIAL RESULT FOR 4TH QUARTER AND YEAR ENDED 31.03.2026
Board Meeting Intimation for Rescheduling Of The Board Meeting Due To The Declared Exchange Holiday On 28.05.2026 On Account Of Holiday E.G. Eid Board Meeting On Next Day 29.05.2026
26-May-2026 | Source : BSEInani Securities Ltdhas informed BSE that the meeting of the Board of Directors of the Company is scheduled on 29/05/2026 inter alia to consider and approve Rescheduling of the Board Meeting due to the declared Exchange Holiday on 28.05.2026 on account of Holiday e.g. Eid Board Meeting on next day 29.05.2026
Corporate Actions

No Upcoming Board Meetings

Inani Securities Ltd has declared 10% dividend, ex-date: 24 Sep 08

No Splits history available

No Bonus history available

No Rights history available
Quality key factors
Valuation key factors
Technicals key factors
 Technical Indicator Scale: Bearish, Mildly Bearish, Sideways, Mildly Bullish, Bullish Turned
 Shareholding Snapshot : Mar 2026
Shareholding Compare (%holding)
Promoters
None
Held by 0 Schemes
Held by 0 FIIs
Ramakanth Inani (14.62%)
Sangeeta (2.39%)
26.49%
Quarterly Results Snapshot (Standalone) - Mar'26 - YoY

YoY Growth in quarter ended Mar 2026 is -6.25% vs -36.00% in Mar 2025

YoY Growth in quarter ended Mar 2026 is -100.00% vs -75.40% in Mar 2025
Half Yearly Results Snapshot (Standalone) - Sep'25
Growth in half year ended Sep 2025 is -38.55% vs 88.64% in Sep 2024
Growth in half year ended Sep 2025 is -76.19% vs 600.00% in Sep 2024
Nine Monthly Results Snapshot (Standalone) - Dec'25
YoY Growth in nine months ended Dec 2025 is -30.97% vs 52.70% in Dec 2024
YoY Growth in nine months ended Dec 2025 is -74.07% vs 350.00% in Dec 2024
Annual Results Snapshot (Standalone) - Mar'26
YoY Growth in year ended Mar 2026 is -26.03% vs 17.74% in Mar 2025
YoY Growth in year ended Mar 2026 is -85.96% vs -56.82% in Mar 2025
About Inani Securities Ltd

Company Coordinates


