
Compare Incap with Similar Stocks
Dashboard
Weak Long Term Fundamental Strength with an average Return on Equity (ROE) of 4.88%
- Poor long term growth as Net Sales has grown by an annual rate of 3.75% and Operating profit at 17.82% over the last 5 years
- Company's ability to service its debt is weak with a poor EBIT to Interest (avg) ratio of 0.49
Negative results in Mar 26
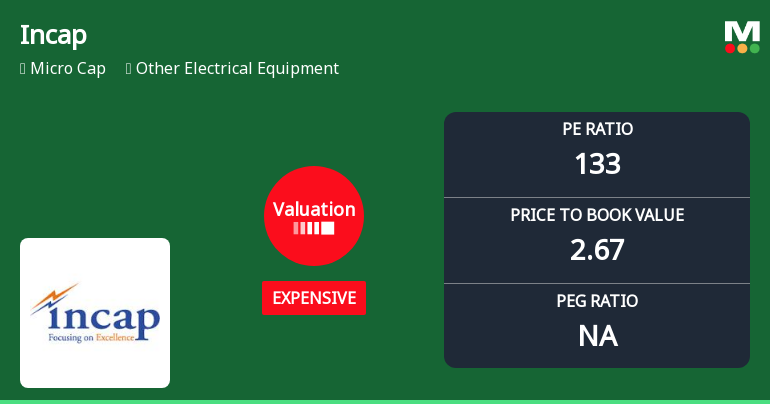
With ROE of 2, it has a Expensive valuation with a 2.5 Price to Book Value
Stock DNA
Other Electrical Equipment
INR 41 Cr (Micro Cap)
123.00
50
1.22%
0.08
2.01%
2.49
Total Returns (Price + Dividend) 
Latest dividend: 1 per share ex-dividend date: Sep-19-2025
Risk Adjusted Returns v/s
Returns Beta

News
Incap Ltd Valuation Shifts to Expensive Amidst Mixed Market Returns
Incap Ltd, a micro-cap player in the Other Electrical Equipment sector, has seen its valuation metrics shift notably, with its price-to-earnings (P/E) ratio surging to 132.86 and price-to-book value (P/BV) rising to 2.67, signalling a transition from fair to expensive territory. Despite this, the stock has delivered strong long-term returns, outperforming the Sensex over five and ten years, though recent price movements reflect some investor caution.
Read full news article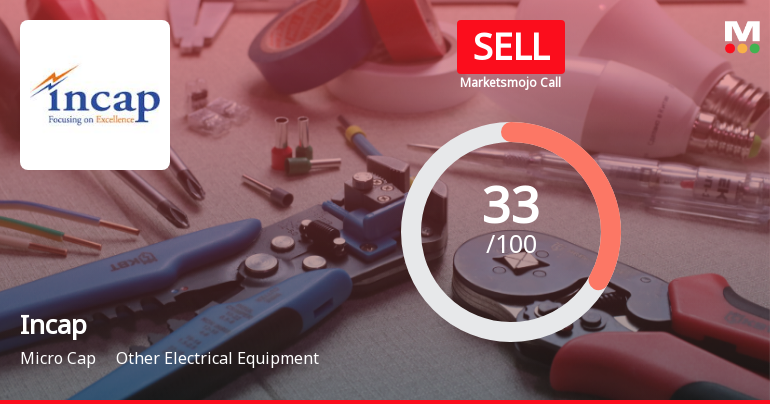
Incap Ltd Upgraded from Strong Sell to Sell on Technical Improvements and Valuation Factors
Incap Ltd, a micro-cap player in the Other Electrical Equipment sector, has seen its investment rating upgraded from Strong Sell to Sell as of 30 May 2026. This change reflects a nuanced shift in the company’s technical outlook amid persistent fundamental challenges, prompting a reassessment of its quality, valuation, financial trend, and technical parameters.
Read full news articleAre Incap Ltd latest results good or bad?
Incap Ltd's latest financial results for Q4 FY26 present a complex picture characterized by significant revenue growth juxtaposed with a notable decline in profitability. The company reported a net profit of -₹0.32 crores, marking a loss compared to a profit of ₹0.17 crores in the same quarter last year. This reflects a fundamental challenge in converting revenue into profit, raising concerns about cost management and operational efficiency. On the revenue front, Incap achieved a year-on-year growth of 65.79%, reaching ₹8.19 crores, which is a substantial increase. However, this growth was accompanied by a sequential increase of only 12.50% from the previous quarter, suggesting that while there is some recovery, it is not sufficient to offset the operational issues at hand. The operating margin fell sharply to 0.37%, down from 5.47% in Q4 FY25, indicating severe margin compression and potential pricing pre...
Read full news article Announcements
Board Meeting Outcome for Outcome Of The Board Meeting To Fix AGM Data And Audited Financial Results
30-May-2026 | Source : BSEOutcome of the Board Meeting
Corporate Action-Board to consider Dividend
30-May-2026 | Source : BSEBoard had recommended dividend @ 10% on face value subjec to approval of shareholders. Board Proposed to conducted AGM on 26th September 2026
Audited Financial Results For The Quarter And Year Ended On 31St March 2026
30-May-2026 | Source : BSEAudited Financial results for the quarter and year ended on 31st March 2026
Corporate Actions

No Upcoming Board Meetings

Incap Ltd has declared 10% dividend, ex-date: 19 Sep 25

No Splits history available

No Bonus history available

No Rights history available
Quality key factors
Valuation key factors
Technicals key factors
 Technical Indicator Scale: Bearish, Mildly Bearish, Sideways, Mildly Bullish, Bullish Turned
 Shareholding Snapshot : Mar 2026
Shareholding Compare (%holding)
Promoters
None
Held by 1 Schemes (0.0%)
Held by 0 FIIs
Neelima Challagulla (24.15%)
Gudapati Ramesh (8.77%)
29.0%
Quarterly Results Snapshot (Standalone) - Mar'26 - YoY

YoY Growth in quarter ended Mar 2026 is 65.79% vs 24.75% in Mar 2025

YoY Growth in quarter ended Mar 2026 is -288.24% vs 750.00% in Mar 2025
Half Yearly Results Snapshot (Standalone) - Sep'25
Growth in half year ended Sep 2025 is 37.87% vs 2.17% in Sep 2024
Growth in half year ended Sep 2025 is -23.53% vs 25.93% in Sep 2024
Nine Monthly Results Snapshot (Standalone) - Dec'25
YoY Growth in nine months ended Dec 2025 is -18.02% vs 85.85% in Dec 2024
YoY Growth in nine months ended Dec 2025 is -25.00% vs 37.50% in Dec 2024
Annual Results Snapshot (Standalone) - Mar'26
YoY Growth in year ended Mar 2026 is -5.69% vs 73.45% in Mar 2025
YoY Growth in year ended Mar 2026 is -57.50% vs 19.40% in Mar 2025
About Incap Ltd

Company Coordinates


