
Compare Incon Engineers with Similar Stocks
Dashboard
With a Negative Book Value, the company has a Weak Long Term Fundamental Strength
- Poor long term growth as Net Sales has grown by an annual rate of -35.72% and Operating profit at 0% over the last 5 years
- The company has a negative book value of Rs 0.78 crore
Flat results in Mar 26
Risky - Negative EBITDA
Stock DNA
Industrial Manufacturing
INR 13 Cr (Micro Cap)
NA (Loss Making)
28
0.00%
-1.01
42.00%
-12.60
Total Returns (Price + Dividend) 
Incon Engineers for the last several years.
Risk Adjusted Returns v/s
Returns Beta

News
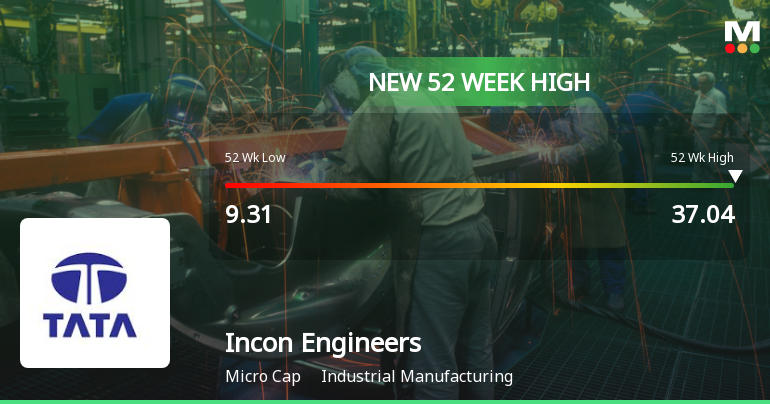
Broad-Based Technical Strength Lifts Incon Engineers Ltd to 52-Week High of Rs 37.04
Surging past its previous peaks, Incon Engineers Ltd touched a fresh 52-week high of Rs 37.04 on 14 Jul 2026, marking a remarkable rally that has seen the stock appreciate by over 259% in the past year, vastly outperforming the Sensex’s decline of 6.2% over the same period.
Read full news article
Broad-Based Technical Strength Lifts Incon Engineers Ltd to 52-Week High of Rs 36.32
Surging past its previous peak, Incon Engineers Ltd reached a new 52-week high of Rs 36.32 on 13 Jul 2026, marking a remarkable rally that has seen the stock appreciate by over 250% in the past year. This milestone comes amid a backdrop of strong technical momentum and sustained gains over the last 19 trading sessions.
Read full news article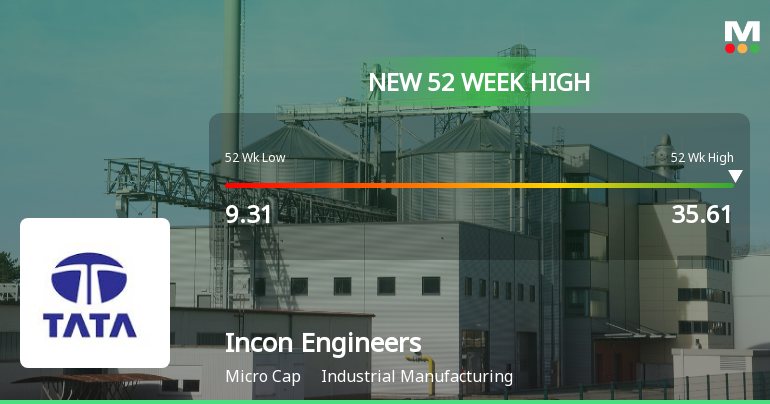
Broad-Based Technical Strength Lifts Incon Engineers Ltd to 52-Week High of Rs 35.61
Surging past its previous peaks, Incon Engineers Ltd touched a new 52-week high of Rs 35.61 on 10 Jul 2026, marking a remarkable rally of 263.37% over the past year against the Sensex’s decline of 6.81%. This milestone caps an 18-day consecutive gain streak, underscoring the stock’s robust momentum and technical strength in a market environment where the Sensex itself is trading 1.03% higher.
Read full news article Announcements
Submission Of Report- Special Window
25-Jul-2026 | Source : BSESubmission of Report-Special Window
Board Meeting Intimation for Board Meeting Intimation
23-Jul-2026 | Source : BSEIncon Engineers Ltdhas informed BSE that the meeting of the Board of Directors of the Company is scheduled on 03/08/2026 inter alia to consider and approve Board Meeting Intimation for Approval of Unaudited Financial Results (Standalone) For The Quarter Ended June 30 2026
Announcement Under Regulation 30 (LODR)-Submission Of Newspaper Publications-Special Window For Re-Lodgement Of Transfer Requests Of Physical Shares.
21-Jul-2026 | Source : BSESubmission of Newspaper Publication-Special Window for re-lodgement of transfer requests of physical shares.
Corporate Actions

03 Aug 2026

No Dividend history available

No Splits history available

No Bonus history available

No Rights history available
Quality key factors
Valuation key factors
Technicals key factors
 Technical Indicator Scale: Bearish, Mildly Bearish, Sideways, Mildly Bullish, Bullish Turned
 Shareholding Snapshot : Jun 2026
Shareholding Compare (%holding)
Promoters
None
Held by 1 Schemes (0.01%)
Held by 0 FIIs
Sreedhar Chowdhury (47.54%)
Genrep Limited (4.62%)
27.83%
Quarterly Results Snapshot (Standalone) - Mar'26 - QoQ
QoQ Growth in quarter ended Mar 2026 is 0.00% vs 0.00% in Dec 2025

QoQ Growth in quarter ended Mar 2026 is 15.38% vs 7.14% in Dec 2025
Half Yearly Results Snapshot (Standalone) - Sep'25
Growth in half year ended Sep 2025 is 0.00% vs 0.00% in Sep 2024
Growth in half year ended Sep 2025 is 28.00% vs 0.00% in Sep 2024
Nine Monthly Results Snapshot (Standalone) - Dec'25

YoY Growth in nine months ended Dec 2025 is -4.76% vs 0.00% in Dec 2024
YoY Growth in nine months ended Dec 2025 is 3.13% vs 17.95% in Dec 2024
Annual Results Snapshot (Standalone) - Mar'26
YoY Growth in year ended Mar 2026 is 28.57% vs 0.00% in Mar 2025
YoY Growth in year ended Mar 2026 is -4.88% vs 12.77% in Mar 2025
About Incon Engineers Ltd

Company Coordinates


