
Compare Incon Engineers with Similar Stocks
Dashboard
With a Negative Book Value, the company has a Weak Long Term Fundamental Strength
- Poor long term growth as Net Sales has grown by an annual rate of -35.72% and Operating profit at 0% over the last 5 years
- The company has a negative book value of Rs 0.78 crore
Flat results in Mar 26
Risky - Negative EBITDA
Stock DNA
Industrial Manufacturing
INR 6 Cr (Micro Cap)
NA (Loss Making)
37
0.00%
-1.01
42.00%
-6.49
Total Returns (Price + Dividend) 
Incon Engineers for the last several years.
Risk Adjusted Returns v/s
Returns Beta

News
Are Incon Engineers Ltd latest results good or bad?
Incon Engineers Ltd's latest financial results for Q4 FY26 reflect significant operational challenges. The company reported net sales of ₹0.07 crores, which indicates minimal business activity, consistent with previous quarters where sales were either negligible or absent. This sporadic revenue generation highlights a lack of consistent operational momentum. The company incurred a net loss of ₹0.11 crores for the quarter, continuing a trend of losses that have persisted over multiple periods. The operating profit margin was recorded at -200.00%, underscoring a substantial mismatch between fixed costs and the meager revenue generated. Employee costs significantly exceeded sales, further illustrating the unsustainable nature of the current operational model. Additionally, Incon Engineers' return on capital employed (ROCE) stands at a severely negative -43.00%, indicating a substantial decline in capital eff...
Read full news article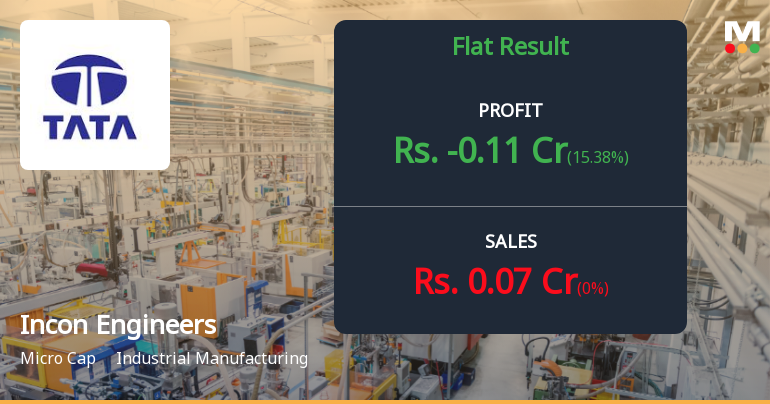
Incon Engineers Q4 FY26: Losses Deepen as Operations Remain Virtually Dormant
Incon Engineers Ltd., a micro-cap industrial manufacturing company, reported a net loss of ₹0.11 crores in Q4 FY26 (Mar'26), marking yet another quarter of operational distress for the Hyderabad-based firm. With minimal revenue generation of just ₹0.07 crores during the quarter and a negative book value of ₹0.62 per share, the company continues to struggle with business viability amidst near-complete operational dormancy.
Read full news article Announcements
Announcement Under Regulation 30 (LODR)
30-May-2026 | Source : BSENewspaper publication of extract of audited financial results for quarter and year ended on march 31 2026
Submission Of Audited Financial Results For The Quarter And Year Ended 31St March 2026.
29-May-2026 | Source : BSESubmission of Audited Financial Results for the quarter and year ended 31st March 2026.
Board Meeting Outcome for Outcome Of Board Meeting - Submission Of Audited Financial Results For The Quarter And Year Ended 31St March 2026.
29-May-2026 | Source : BSEOutcome of Board Meeting - Submission of Audited Financial Results for the quarter and year ended 31st March 2026.
Corporate Actions

No Upcoming Board Meetings

No Dividend history available

No Splits history available

No Bonus history available

No Rights history available
Quality key factors
Valuation key factors
Technicals key factors
 Technical Indicator Scale: Bearish, Mildly Bearish, Sideways, Mildly Bullish, Bullish Turned
 Shareholding Snapshot : Mar 2026
Shareholding Compare (%holding)
Promoters
None
Held by 1 Schemes (0.01%)
Held by 0 FIIs
Sreedhar Chowdhury (47.54%)
Genrep Limited (4.62%)
27.84%
Quarterly Results Snapshot (Standalone) - Mar'26 - QoQ
QoQ Growth in quarter ended Mar 2026 is 0.00% vs 0.00% in Dec 2025

QoQ Growth in quarter ended Mar 2026 is 15.38% vs 7.14% in Dec 2025
Half Yearly Results Snapshot (Standalone) - Sep'25
Growth in half year ended Sep 2025 is 0.00% vs 0.00% in Sep 2024
Growth in half year ended Sep 2025 is 28.00% vs 0.00% in Sep 2024
Nine Monthly Results Snapshot (Standalone) - Dec'25

YoY Growth in nine months ended Dec 2025 is -4.76% vs 0.00% in Dec 2024
YoY Growth in nine months ended Dec 2025 is 3.13% vs 17.95% in Dec 2024
Annual Results Snapshot (Standalone) - Mar'26
YoY Growth in year ended Mar 2026 is 28.57% vs 0.00% in Mar 2025
YoY Growth in year ended Mar 2026 is -4.88% vs 12.77% in Mar 2025
About Incon Engineers Ltd

Company Coordinates


