
Compare Incredible Indus with Similar Stocks
Dashboard
Weak Long Term Fundamental Strength with an average Return on Capital Employed (ROCE) of 8.57%
- Poor long term growth as Net Sales has grown by an annual rate of 11.21% and Operating profit at 13.54% over the last 5 years
Flat results in Mar 26
Below par performance in long term as well as near term
Stock DNA
Iron & Steel Products
INR 159 Cr (Micro Cap)
14.00
26
0.00%
0.11
7.33%
1.01
Total Returns (Price + Dividend) 
Incredible Indus for the last several years.
Risk Adjusted Returns v/s
Returns Beta

News
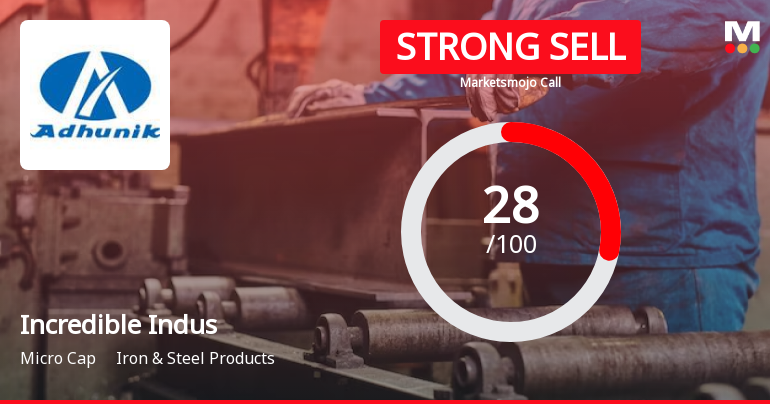
Incredible Industries Ltd is Rated Strong Sell
Incredible Industries Ltd is rated Strong Sell by MarketsMOJO, with this rating last updated on 12 January 2026. However, the analysis and financial metrics discussed here reflect the stock’s current position as of 17 July 2026, providing investors with an up-to-date view of the company’s fundamentals, valuation, financial trends, and technical outlook.
Read full news article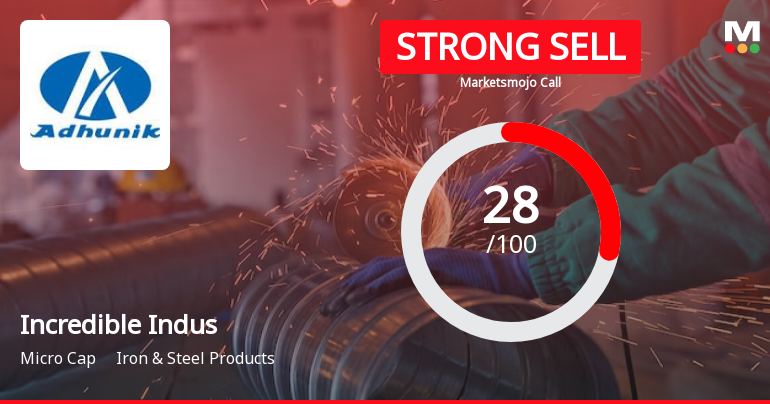
Incredible Industries Ltd is Rated Strong Sell
Incredible Industries Ltd is rated Strong Sell by MarketsMOJO, with this rating last updated on 12 January 2026. However, the analysis and financial metrics discussed here reflect the stock’s current position as of 06 July 2026, providing investors with an up-to-date perspective on the company’s performance and outlook.
Read full news article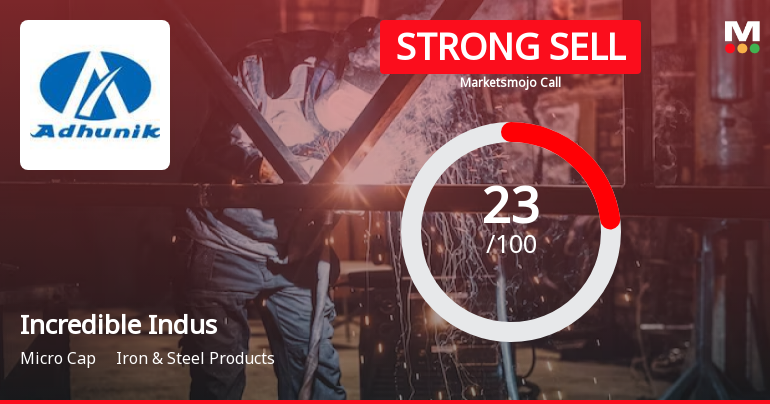
Incredible Industries Ltd is Rated Strong Sell
Incredible Industries Ltd is rated Strong Sell by MarketsMOJO, with this rating last updated on 12 January 2026. However, the analysis and financial metrics discussed here reflect the stock’s current position as of 24 June 2026, providing investors with the latest insights into the company’s performance and outlook.
Read full news article Announcements
Compliances-Certificate under Reg. 74 (5) of SEBI (DP) Regulations 2018
10-Jul-2026 | Source : BSECertificate under Regulation 74(5) of the SEBI (Depositories and Participants) Regulations 2018 for the quarter ended June 30 2026.
Announcement under Regulation 30 (LODR)-Credit Rating
08-Jul-2026 | Source : BSEDisclosure under Regulation 30 of SEBI (Listing Obligations and Disclosure Requirements) Regulations 2015 for external credit rating assigned and reaffirmed to the Company from Acuite Ratings and Research Limited.
Closure of Trading Window
23-Jun-2026 | Source : BSEIntimation for Closure of Trading Window
Corporate Actions

No Upcoming Board Meetings

No Dividend history available

No Splits history available

No Bonus history available

No Rights history available
Quality key factors
Valuation key factors
Technicals key factors
 Technical Indicator Scale: Bearish, Mildly Bearish, Sideways, Mildly Bullish, Bullish Turned
 Shareholding Snapshot : Jun 2026
Shareholding Compare (%holding)
Promoters
None
Held by 0 Schemes
Held by 0 FIIs
Mahananda Suppliers Limited (35.5%)
Vrindavan Advisory Services Llp (9.27%)
11.63%
Quarterly Results Snapshot (Standalone) - Mar'26 - QoQ

QoQ Growth in quarter ended Mar 2026 is 16.11% vs -10.91% in Dec 2025
QoQ Growth in quarter ended Mar 2026 is 152.51% vs 20.13% in Dec 2025
Half Yearly Results Snapshot (Standalone) - Sep'25
Growth in half year ended Sep 2025 is 18.63% vs -16.72% in Sep 2024

Growth in half year ended Sep 2025 is 43.65% vs 94.62% in Sep 2024
Nine Monthly Results Snapshot (Standalone) - Dec'25
YoY Growth in nine months ended Dec 2025 is 18.05% vs -11.73% in Dec 2024
YoY Growth in nine months ended Dec 2025 is 5.11% vs 134.15% in Dec 2024
Annual Results Snapshot (Standalone) - Mar'26
YoY Growth in year ended Mar 2026 is 11.13% vs -7.58% in Mar 2025
YoY Growth in year ended Mar 2026 is -7.77% vs 109.21% in Mar 2025
About Incredible Industries Ltd

Company Coordinates


