
Compare India Cem. Cap. with Similar Stocks
Stock DNA
Non Banking Financial Company (NBFC)
INR 34 Cr (Micro Cap)
NA (Loss Making)
21
0.00%
0.00
-1.12%
1.92
Total Returns (Price + Dividend) 
India Cem. Cap. for the last several years.
Risk Adjusted Returns v/s
Returns Beta

News

India Cements Capital Ltd is Rated Sell
India Cements Capital Ltd is rated 'Sell' by MarketsMOJO, with this rating last updated on 24 June 2026. However, the analysis and financial metrics discussed below reflect the company’s current position as of 08 July 2026, providing investors with the most recent and relevant data to assess the stock’s outlook.
Read full news article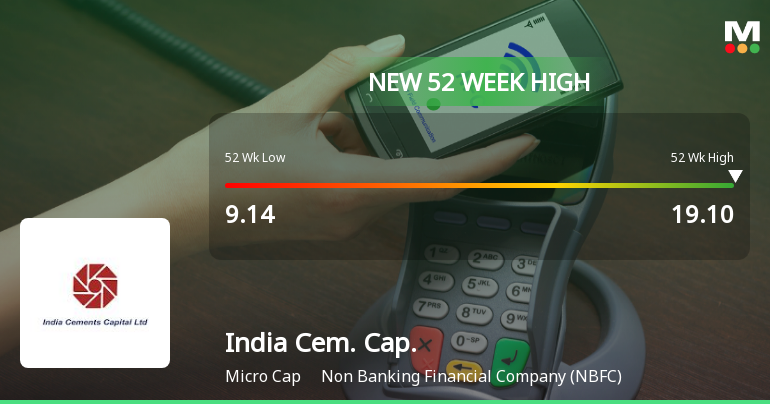
Broad-Based Technical Strength Lifts India Cements Capital Ltd to 52-Week High of Rs 19.1
With a decisive breakout to Rs 19.1 on 6 Jul 2026, India Cements Capital Ltd has reached a fresh 52-week high, marking a significant milestone in its price momentum. This advance comes amid a backdrop of sustained technical strength and a broader market rally, underscoring the stock's robust upward trajectory over the past year.
Read full news article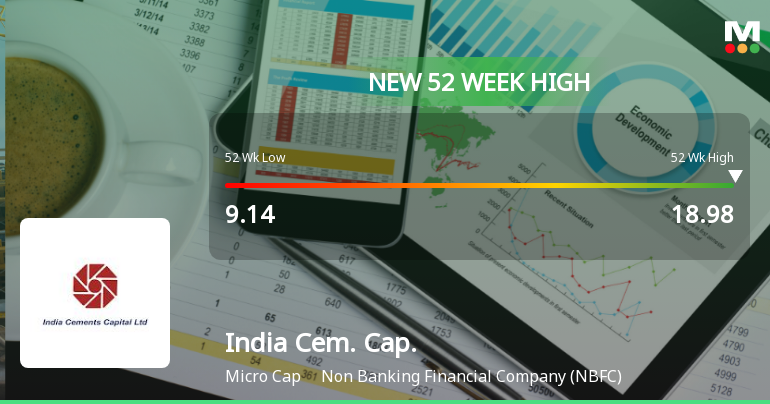
Broad-Based Technical Strength Lifts India Cements Capital Ltd to 52-Week High of Rs 18.98
With a 10.08% gain over the past year, India Cements Capital Ltd has outpaced the Sensex, which declined 6.27% in the same period, culminating in a fresh 52-week high of Rs 18.98 on 3 Jul 2026. This milestone reflects a sustained rally fuelled by a confluence of bullish technical indicators and positive price momentum across multiple timeframes.
Read full news article Announcements
Disclosures under Reg. 29(2) of SEBI (SAST) Regulations 2011
17-Jul-2026 | Source : BSEThe Exchange has received the disclosure under Regulation 29(2) of SEBI (Substantial Acquisition of Shares & Takeovers) Regulations 2011 for M Amarnath & Others
Disclosures under Reg. 29(2) of SEBI (SAST) Regulations 2011
16-Jul-2026 | Source : BSEThe Exchange has received the disclosure under Regulation 29(2) of SEBI (Substantial Acquisition of Shares & Takeovers) Regulations 2011 for M Amarnath & Others
Disclosures under Reg. 29(2) of SEBI (SAST) Regulations 2011
15-Jul-2026 | Source : BSEThe Exchange has received the disclosure under Regulation 29(2) of SEBI (Substantial Acquisition of Shares & Takeovers) Regulations 2011 for M Amarnath & Others
Corporate Actions

No Upcoming Board Meetings

No Dividend history available

No Splits history available

No Bonus history available

No Rights history available
Quality key factors
Valuation key factors
Technicals key factors
 Technical Indicator Scale: Bearish, Mildly Bearish, Sideways, Mildly Bullish, Bullish Turned
 Shareholding Snapshot : Jun 2026
Shareholding Compare (%holding)
Promoters
None
Held by 1 Schemes (0.0%)
Held by 0 FIIs
Sri Saradha Logistics Private Limited (50.02%)
Maitreyan Amarnath (23.64%)
48.7%
Quarterly Results Snapshot (Consolidated) - Mar'26 - YoY

YoY Growth in quarter ended Mar 2026 is 4.13% vs -20.39% in Mar 2025

YoY Growth in quarter ended Mar 2026 is -880.00% vs -64.29% in Mar 2025
Half Yearly Results Snapshot (Consolidated) - Sep'25
Growth in half year ended Sep 2025 is -18.59% vs -15.45% in Sep 2024
Growth in half year ended Sep 2025 is -76.92% vs -54.39% in Sep 2024
Nine Monthly Results Snapshot (Consolidated) - Dec'25
YoY Growth in nine months ended Dec 2025 is -14.38% vs -17.67% in Dec 2024
YoY Growth in nine months ended Dec 2025 is -114.00% vs -63.50% in Dec 2024
Annual Results Snapshot (Consolidated) - Mar'26
YoY Growth in year ended Mar 2026 is -10.38% vs -18.27% in Mar 2025
YoY Growth in year ended Mar 2026 is -180.36% vs -62.91% in Mar 2025
About India Cements Capital Ltd

Company Coordinates


