
Compare India Glycols with Similar Stocks
Dashboard
Weak Long Term Fundamental Strength with an average Return on Capital Employed (ROCE) of 8.62%
- Poor long term growth as Net Sales has grown by an annual rate of 10.31% and Operating profit at 18.29% over the last 5 years
- Low ability to service debt as the company has a high Debt to EBITDA ratio of 2.60 times
The company has declared Positive results for the last 5 consecutive quarters
With ROCE of 10.8, it has a Fair valuation with a 2 Enterprise value to Capital Employed
Despite the size of the company, domestic mutual funds hold only 0.56% of the company
Stock DNA
Commodity Chemicals
INR 7,756 Cr (Small Cap)
26.00
47
1.06%
0.56
10.00%
2.61
Total Returns (Price + Dividend) 
Latest dividend: 7.476703818746573 per share ex-dividend date: Mar-23-2026
Risk Adjusted Returns v/s
Returns Beta

News
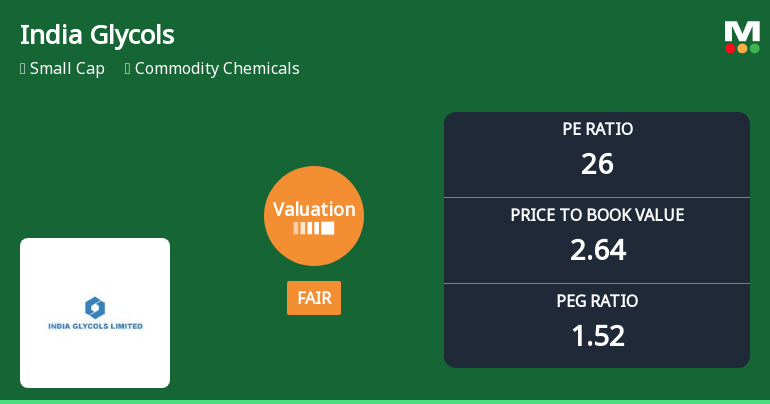
India Glycols Ltd Valuation Shifts to Fair Amid Strong Market Performance
India Glycols Ltd has witnessed a notable shift in its valuation parameters, moving from an attractive to a fair valuation grade, reflecting evolving market perceptions amid a volatile commodity chemicals sector. This article analyses the recent changes in key valuation metrics such as the price-to-earnings (P/E) and price-to-book value (P/BV) ratios, comparing them with historical trends and peer averages to assess the stock’s price attractiveness for investors.
Read full news article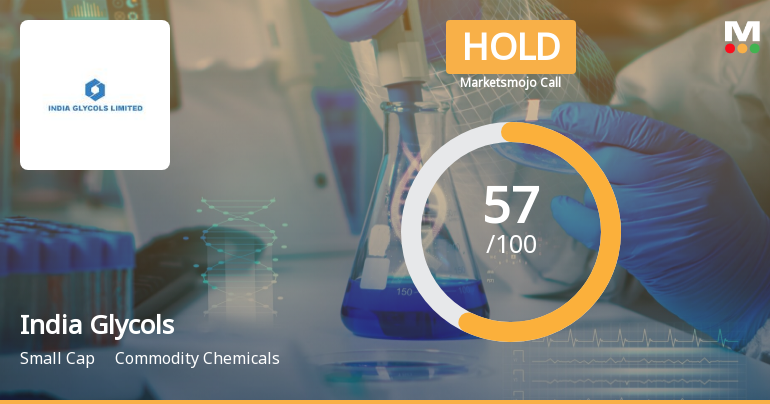
India Glycols Ltd is Rated Hold
India Glycols Ltd is rated 'Hold' by MarketsMOJO, with this rating last updated on 20 May 2026. However, the analysis and financial metrics discussed here reflect the company’s current position as of 15 July 2026, providing investors with an up-to-date perspective on the stock’s fundamentals, valuation, financial trends, and technical outlook.
Read full news article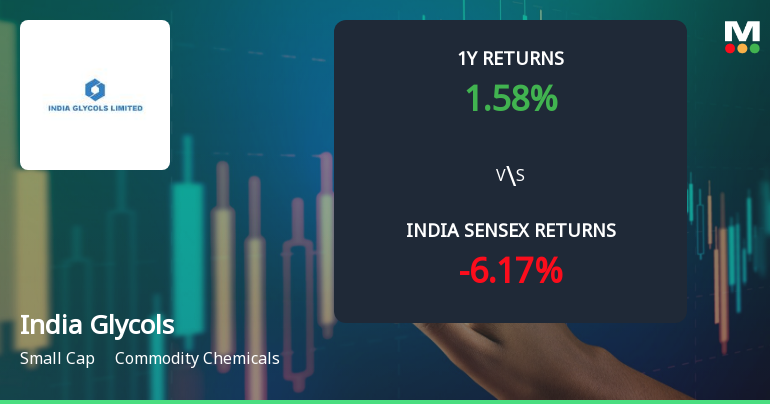
India Glycols Ltd Technical Momentum Shifts Signal Bullish Outlook Amid Market Volatility
India Glycols Ltd has witnessed a notable shift in its technical momentum, moving from a mildly bullish to a bullish trend, supported by a mix of positive and mixed signals across key indicators such as MACD, RSI, Bollinger Bands, and moving averages. This technical evolution, coupled with strong relative returns against the Sensex, suggests a cautiously optimistic outlook for this small-cap commodity chemicals player.
Read full news article Announcements
India Glycols Limited - Outcome of Board Meeting
13-Nov-2019 | Source : NSEIndia Glycols Limited has informed the Exchange regarding Board meeting held on November 11, 2019.
India Glycols Limited - Trading Window
05-Nov-2019 | Source : NSEIndia Glycols Limited has informed the Exchange regarding the Trading Window closure pursuant to SEBI (Prohibition of Insider Trading) Regulations, 2015
India Glycols Limited - Credit Rating
18-Oct-2019 | Source : NSEIndia Glycols Limited has informed the Exchange regarding Credit Rating
Corporate Actions

No Upcoming Board Meetings

India Glycols Ltd has declared 150% dividend, ex-date: 23 Mar 26

India Glycols Ltd has announced 5:10 stock split, ex-date: 12 Aug 25

No Bonus history available

No Rights history available
Quality key factors
Valuation key factors
Technicals key factors
 Technical Indicator Scale: Bearish, Mildly Bearish, Sideways, Mildly Bullish, Bullish Turned
 Shareholding Snapshot : Jun 2026
Shareholding Compare (%holding)
Promoters
None
Held by 8 Schemes (0.22%)
Held by 68 FIIs (2.24%)
Kashipur Holdings Limited (49.77%)
Puneet Bhatia (1.77%)
26.15%
Quarterly Results Snapshot (Consolidated) - Mar'26 - QoQ

QoQ Growth in quarter ended Mar 2026 is -11.43% vs 0.93% in Dec 2025

QoQ Growth in quarter ended Mar 2026 is 28.58% vs 3.86% in Dec 2025
Half Yearly Results Snapshot (Consolidated) - Sep'25
Growth in half year ended Sep 2025 is 10.51% vs 31.85% in Sep 2024
Growth in half year ended Sep 2025 is 25.63% vs 23.49% in Sep 2024
Nine Monthly Results Snapshot (Consolidated) - Dec'25
YoY Growth in nine months ended Dec 2025 is 11.36% vs 22.69% in Dec 2024
YoY Growth in nine months ended Dec 2025 is 23.36% vs 27.62% in Dec 2024
Annual Results Snapshot (Consolidated) - Mar'26
YoY Growth in year ended Mar 2026 is 11.76% vs 14.40% in Mar 2025
YoY Growth in year ended Mar 2026 is 26.78% vs 33.49% in Mar 2025
About India Glycols Ltd

Company Coordinates


