
Compare Indiabulls with Similar Stocks
Dashboard
Company has a Debt to Equity ratio (avg) of 0.03 times
Healthy long term growth as Net Sales has grown by an annual rate of 37.68% and Operating profit at 59.45%
With a growth in Net Sales of 321.34%, the company declared Outstanding results in Mar 26
Market Beating performance in long term as well as near term
Stock DNA
Diversified Commercial Services
INR 6,034 Cr (Micro Cap)
18.00
15
0.00%
-0.13
11.07%
2.00
Total Returns (Price + Dividend) 
Latest dividend: 0.8915 per share ex-dividend date: May-11-2018
Risk Adjusted Returns v/s
Returns Beta

News

Indiabulls Limited is Rated Buy by MarketsMOJO
Indiabulls Limited is rated 'Buy' by MarketsMOJO, with this rating last updated on 02 June 2026. However, the analysis and financial metrics discussed here reflect the stock's current position as of 25 June 2026, providing investors with the most up-to-date insight into the company’s performance and outlook.
Read full news article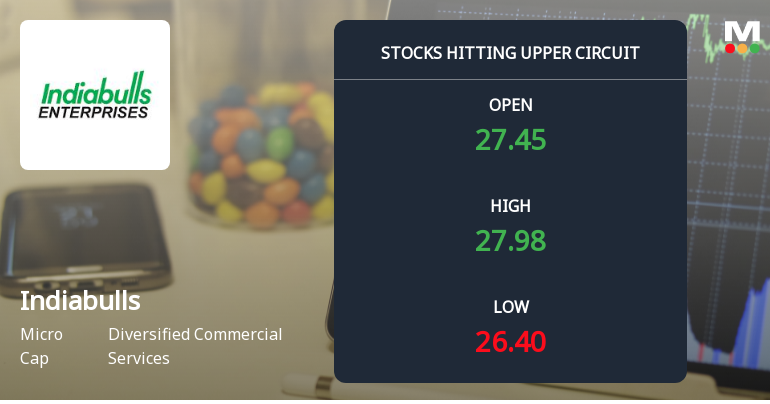
Indiabulls Limited Locks at Upper Circuit With 2.2% Gain — Buyers Queue, Sellers Absent
At Rs 28.65, the buying was done — not because demand dried up, but because the exchange wouldn't let the stock go any higher. Indiabulls Limited locked at its upper circuit of 2.2% on 23 Jun 2026, with buyers queuing and no sellers willing to part with shares.
Read full news article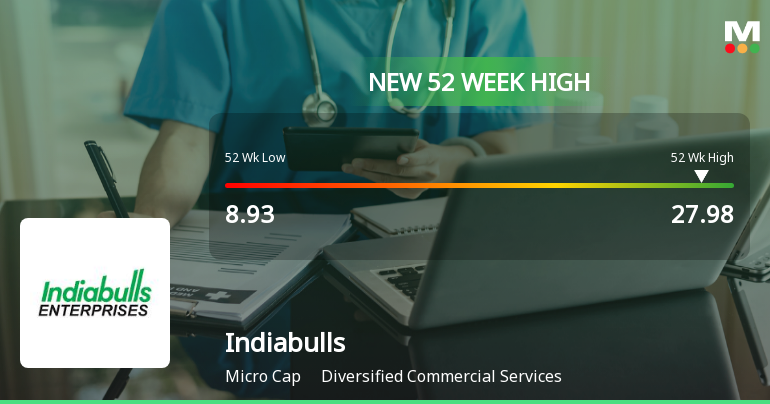
Broad-Based Technical Strength Lifts Indiabulls Limited to 52-Week High of Rs 27.98
Surging to a new 52-week high of Rs 27.98 on 23 Jun 2026, Indiabulls Limited has demonstrated remarkable price momentum, outperforming the broader market with a 48.39% gain over the past year against the Sensex’s decline of 5.82%. This milestone caps a sustained rally that has seen the stock climb from a low of Rs 8.93, reflecting strong technical alignment across multiple timeframes.
Read full news article Announcements
Indiabulls Integrated Services Limited - Statement of deviation(s) or variation(s) under Reg. 32
15-Nov-2019 | Source : NSEIndiabulls Integrated Services Limitedited has informed the Exchange regarding Statement of deviation(s) or variation(s) under Reg. 32 of SEBI (LODR) Regulations 2015
Name and Symbol Change
04-Jun-2018 | Source : NSE
| Members of the Exchange are hereby informed that the name of SORIL Holdings and Ventures Limited shall be changed to Indiabulls Integrated Services Limited and the trading symbol of the Company be changed from SORILHOLD to IBULISL w.e.f. June 08, 2018. |
Allotment of Securities
28-May-2018 | Source : NSE
| SORIL Holdings and Ventures Limited has informed the Exchange regarding allotment of 1750000000 securities pursuant to Preferential Issue at its meeting held on May 28, 2018 |
Corporate Actions

No Upcoming Board Meetings

Indiabulls Limited has declared 50% dividend, ex-date: 11 May 18

No Splits history available

No Bonus history available

No Rights history available
Quality key factors
Valuation key factors
Technicals key factors
 Technical Indicator Scale: Bearish, Mildly Bearish, Sideways, Mildly Bullish, Bullish Turned
 Shareholding Snapshot : Mar 2026
Shareholding Compare (%holding)
Non Institution
None
Held by 0 Schemes
Held by 44 FIIs (17.0%)
Inuus Developers Private Limited (19.72%)
Acm Global Fund Vcc (6.56%)
29.89%
Quarterly Results Snapshot (Consolidated) - Mar'26 - QoQ

QoQ Growth in quarter ended Mar 2026 is 321.34% vs -58.96% in Dec 2025

QoQ Growth in quarter ended Mar 2026 is 146.94% vs 11,078.87% in Dec 2025
Half Yearly Results Snapshot (Consolidated) - Sep'25
Growth in half year ended Sep 2025 is 38.72% vs 98,383.33% in Sep 2024
Growth in half year ended Sep 2025 is 98.39% vs -726.60% in Sep 2024
Nine Monthly Results Snapshot (Consolidated) - Dec'25
YoY Growth in nine months ended Dec 2025 is 23.94% vs 17,13,850.00% in Dec 2024
YoY Growth in nine months ended Dec 2025 is 180.61% vs -547.89% in Dec 2024
Annual Results Snapshot (Consolidated) - Mar'26
YoY Growth in year ended Mar 2026 is 87.54% vs 22,21,750.00% in Mar 2025
YoY Growth in year ended Mar 2026 is 205.38% vs -1,102.68% in Mar 2025
About Indiabulls Limited

Company Coordinates


