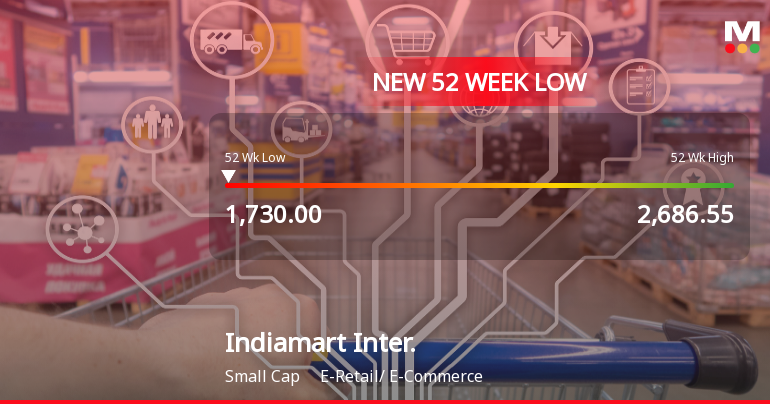
Indiamart Inter.

  • Market Cap: Small Cap
  • Industry: E-Retail/ E-Commerce
  • ISIN: INE933S01016
  • NSEID: INDIAMART
  • BSEID: 542726
INR
1,756.45
6.65 (0.38%)
BSENSE

Aug 26, 01:36 PM

BSE+NSE Vol: 23.68 k

  • Price Points
  • Score
  • Mojo Parameters
  • Total Return
  • News and Corporate Actions
  • Key factors
  • Shareholding
  • Financials
  • CompanyCV
stock-summaryPrice Point
High/Low

1Day

52 Week

Valuation
Technical
Day's Volume

CASH

23.68 k (-36.41%) Volume

Shareholding (Jun 2026)

FII

19.92%

Held by 174 FIIs

DII

12.11%

Held by 20 DIIs

Promoter

49.07%

Why is Indiamart Intermesh Ltd falling/rising?

26-Aug-2026

As of 25-Aug, Indiamart Intermesh Ltd's stock price is slightly rising at 1,749.80, but it has significantly underperformed year-to-date and over the past year, with a decline of 21.32% and 33.55%, respectively. Despite a recent uptick, challenges such as high valuation and decreased investor participation indicate potential long-term difficulties.

As of 25-Aug, Indiamart Intermesh Ltd's stock price is rising slightly, currently at 1,749.80, with a change of 5.05 (0.29%) upward. The stock has been gaining for the last two days, reflecting a return of 0.59% during this period. This positive movement may be attributed to its inline performance with the sector today and a high dividend yield of 3.44% at the current price, which can attract investors looking for income.<BR><BR>However, despite the recent uptick, the stock has shown significant underperformance over longer periods. For instance, it has declined by 21.32% year-to-date and 33.55% over the past year, indicating ongoing challenges. The stock is also close to its 52-week low, just 1.65% away from Rs 1,723.8. Additionally, there has been a notable decrease in investor participation, with delivery volume falling by 39.37% against the 5-day average, which could signal waning interest among investors.<BR><BR>While the company boasts high management efficiency with a return on equity (ROE) of 18.79% and is net-debt free, its long-term growth prospects appear poor, with operating profit growing at an annual rate of only 9.41% over the last five years. Furthermore, the stock's valuation is considered expensive, trading at a price-to-book value of 4.4, and it has consistently underperformed against benchmarks over the last three years. Thus, while the stock is experiencing a short-term rise, the broader context suggests ongoing challenges that may affect its future performance.

View full answer

Who are in the management team of Indiamart Inter.?

14-Aug-2026

The management team of Indiamart Inter. includes Dinesh Chandra Agarwal (Managing Director & CEO), Brijesh Agrawal (Whole-time Director), and several independent and non-executive directors, along with key roles like Company Secretary and Additional Directors. They are responsible for the company's strategic direction and operations.

The management team of Indiamart Inter. includes the following key individuals:<BR><BR>1. **Dinesh Chandra Agarwal** - Managing Director & CEO<BR>2. **Brijesh Agrawal** - Whole-time Director<BR>3. **Dhruv Prakash** - Non-Executive & Non-Independent Director<BR>4. **Rajesh Sawhney** - Independent Director<BR>5. **Vivek Narayan Gour** - Independent Director<BR>6. **Manoj Bhargava** - Company Secretary & Compliance Officer<BR>7. **Pallavi Dinodia** - Additional Director<BR>8. **Aakash Chaudhary** - Additional Director<BR><BR>This team plays a crucial role in guiding the company's strategic direction and operations.

View full answer

What does Indiamart Inter. do?

14-Aug-2026

Indiamart Intermesh Ltd is a Small Cap company in the E-Retail/E-Commerce industry, incorporated in 1999, with recent quarterly net sales of 414 Cr and net profit of 172 Cr as of June 2026. Key metrics include a P/E of 22.00, a dividend yield of 3.36%, and a market cap of INR 10,858 Cr.

Overview: <BR>Indiamart Intermesh Ltd operates in the E-Retail/E-Commerce industry and is categorized as a Small Cap company.<BR><BR>History: <BR>Indiamart Intermesh Limited was incorporated as a Public limited Company on September 13, 1999. The company received its certificate for commencement of business on October 27, 1999. The latest quarterly results reported net sales and net profit for June 2026.<BR><BR>Financial Snapshot: <BR>Net Sales: 414 Cr (Quarterly Results - Jun 2026) <BR>Net Profit: 172 Cr (Quarterly Results - Jun 2026) <BR>Market cap: INR 10,858 Cr (Small Cap)<BR><BR>Key Metrics: <BR>P/E: 22.00 <BR>Industry P/E: 22 <BR>Dividend Yield: 3.36% <BR>Debt Equity: -1.29 <BR>Return on Equity: 19.78% <BR>Price to Book: 4.47<BR><BR>Contact Details: <BR>Address: 1st Floor 29-Daryaganj, Netaji Subash Marg New Delhi New Delhi : 110002 <BR>Tel: 91-11-30272100 <BR>Email: cs@indiamart.com <BR>Website: http://www.indiamart.com

View full answer

Who are the peers of the Indiamart Inter.?

14-Aug-2026

Indiamart Inter.'s peers include Info Edg. (India), Swiggy, Cartrade Tech, and Just Dial, among others. Info Edg. shows excellent management and growth, while Indiamart Inter. has below-average growth and a 1-year return of -29.33%.

Peers: The peers of Indiamart Inter. are Info Edg.(India), Swiggy, Cartrade Tech, Brainbees Solut., Just Dial, RattanIndia Ent, Macfos, Matrimony.com, and iStreet Network.<BR><BR>Quality Snapshot: Excellent management risk is observed at Info Edg.(India) and Macfos, while Average management risk is found at Cartrade Tech, RattanIndia Ent, and the rest. Below Average management risk is noted for Swiggy, Brainbees Solut., Just Dial, and iStreet Network. Growth is Excellent at Info Edg.(India) and Macfos, Good at Cartrade Tech, Brainbees Solut., and Just Dial, while Below Average growth is seen at Indiamart Inter., RattanIndia Ent., Matrimony.com, and the rest. Excellent capital structure is present at Info Edg.(India), Indiamart Inter., Macfos, and Matrimony.com, while Average capital structure is found at RattanIndia Ent, and the rest.<BR><BR>Return Snapshot: The peer with the highest 1-year return is iStreet Network at 166.45%, while the lowest is Swiggy at -29.81%. Indiamart Inter.'s 1-year return is -29.33%, which is slightly better than Swiggy's. Additionally, the six-month return is negative for Swiggy, Brainbees Solut., RattanIndia Ent., and Indiamart Inter.

View full answer

How big is Indiamart Inter.?

14-Aug-2026

As of 14th August, Indiamart Intermesh Ltd has a market capitalization of 10,732.85 Cr, with recent net sales of 1,611.30 Cr and net profit of 493.40 Cr over the last four quarters.

As of 14th August, <BR><BR>Market Cap: Indiamart Intermesh Ltd has a market capitalization of 10,732.85 Cr, categorizing it as a Small Cap company.<BR><BR>Recent Quarterly Performance: The sum of Net Sales for the latest 4 quarters is 1,611.30 Cr, while the sum of Net Profit for the same period is 493.40 Cr.<BR><BR>Balance Sheet Snapshot: The reporting period is March 2026, with Shareholder's Funds amounting to 2,400.38 Cr and Total Assets valued at 4,624.54 Cr.

View full answer

Are Indiamart Intermesh Ltd latest results good or bad?

22-Jul-2026

Indiamart Intermesh Ltd's latest Q1 FY27 results show strong revenue growth and a significant profit increase, but concerns arise from a heavy reliance on non-operating income and declining year-on-year operating margins, indicating mixed performance. Investors should be cautious when evaluating the sustainability of these results.

Indiamart Intermesh Ltd's latest results for Q1 FY27 present a mixed picture. On the positive side, the company reported a consolidated net profit of ₹172.20 crore, which is a remarkable increase of 243.03% quarter-on-quarter and 12.18% year-on-year. Additionally, revenue reached ₹414.40 crore, marking a 2.50% increase from the previous quarter and an 11.37% increase year-on-year, indicating strong demand for its B2B digital commerce platform.<BR><BR>However, there are concerns regarding the quality of earnings, as a significant portion of the profit was derived from other income, which constituted 46.05% of profit before tax. This heavy reliance on non-operating income raises questions about the sustainability of the reported profitability. Furthermore, while the operating margin improved quarter-on-quarter to 35.35%, it has declined year-on-year, reflecting ongoing pressure on core business profitability.<BR><BR>Overall, while the topline growth and profit increase are encouraging, the volatility in net profit and reliance on other income suggest that the results are not entirely positive. Investors should be cautious and consider these factors when evaluating the company's performance.

View full answer

Should I buy, sell or hold Indiamart Intermesh Ltd?

22-Jul-2026

When is the next results date for Indiamart Intermesh Ltd?

15-Jul-2026

The next results date for Indiamart Intermesh Ltd is July 21, 2026.

The next results date for Indiamart Intermesh Ltd is scheduled for July 21, 2026.

View full answer

Is Indiamart Inter. technically bullish or bearish?

05-Dec-2025

As of December 4, 2025, the technical trend is mildly bearish, supported by bearish MACD readings and Bollinger Bands, despite some divergence from the KST and daily moving averages.

As of 4 December 2025, the technical trend has changed from sideways to mildly bearish. The current stance is bearish, with key indicators supporting this view. Both the weekly and monthly MACD readings are bearish, and Bollinger Bands also indicate a bearish trend. The Dow Theory shows a mildly bearish stance on the weekly chart, while the KST is mildly bullish on the monthly chart, suggesting some divergence. The daily moving averages are mildly bullish, but this is overshadowed by the overall bearish signals from the weekly indicators. The stock has underperformed compared to the Sensex over the past month and year, further reinforcing the bearish outlook.

View full answer

How has been the historical performance of Indiamart Inter.?

24-Nov-2025

Indiamart Inter. has shown consistent growth from March 2019 to March 2025, with net sales increasing from 507.40 crore to 1,388.40 crore, and profit after tax rising from 20.10 crore to 599.80 crore. The company's earnings per share surged from 7.03 to 91.78, reflecting strong operational efficiency and asset growth.

Answer:<BR>The historical performance of Indiamart Inter. shows a consistent growth trajectory in net sales and profitability over the years leading up to March 2025.<BR><BR>Breakdown:<BR>Indiamart Inter. has demonstrated significant growth in net sales, increasing from 638.90 crore in March 2020 to 1,388.40 crore in March 2025. This upward trend is reflected in total operating income, which also rose from 507.40 crore in March 2019 to 1,388.40 crore in March 2025. The company's operating profit (PBDIT) has similarly improved, reaching 795.20 crore in March 2025, up from just 58.00 crore in March 2019. Profit before tax has shown a robust increase, climbing from 53.90 crore in March 2019 to 754.90 crore in March 2025, while profit after tax reached 599.80 crore in March 2025, compared to 20.10 crore in March 2019. The earnings per share (EPS) have also surged, from 7.03 in March 2019 to 91.78 in March 2025. On the balance sheet, total assets increased from 1,098.36 crore in March 2020 to 4,129.95 crore in March 2025, with total liabilities rising correspondingly. The cash flow from operating activities has improved, reaching 623.00 crore in March 2025, indicating strong operational efficiency. Overall, Indiamart Inter. has shown a solid performance with increasing revenues, profits, and asset growth over the years.

View full answer

Is Indiamart Inter. overvalued or undervalued?

09-Jun-2025

As of May 13, 2020, IndiaMART InterMESH Ltd. is considered very expensive and overvalued, with a high PE ratio of 26.57 and an EV to EBITDA of 22.56, despite a recent 1-week return of 3.96% that outperformed the Sensex, while its 1-year decline of 4.98% contrasts with the Sensex's gain of 7.57%.

As of 13 May 2020, the valuation grade for IndiaMART InterMESH Ltd. has moved from does not qualify to very expensive. The company is currently overvalued, as indicated by its high PE ratio of 26.57, a Price to Book Value of 6.70, and an EV to EBITDA of 22.56. These ratios suggest that the stock is trading at a premium compared to its earnings and book value.<BR><BR>In comparison to its peer, IndiaMART InterMESH Ltd. has a similar PE ratio of 26.57 and an EV to EBITDA of 22.56, indicating that it is not only expensive relative to its own historical valuations but also compared to its peers. The company's recent stock performance shows a 1-week return of 3.96%, outperforming the Sensex's 1.39%, but the longer-term view reveals a 1-year decline of 4.98% against the Sensex's gain of 7.57%, reinforcing the notion that the stock is overvalued.

View full answer

Who are the top shareholders of the Indiamart Inter.?

06-Jun-2025

The top shareholders of Indiamart Inter. include Dinesh Chandra Agarwal with 28.03%, 19 mutual fund schemes with 13.64%, 220 foreign institutional investors holding 18.95%, and SBI Small Cap Fund as the largest public shareholder at 4.42%. Individual investors collectively own 14.51% of the company.

The top shareholders of Indiamart Inter. include the promoters, with Dinesh Chandra Agarwal being the individual with the highest holding at 28.03%. Additionally, the company has significant institutional investment, with 19 mutual fund schemes holding a combined 13.64% and 220 foreign institutional investors (FIIs) holding 18.95%. The highest public shareholder is SBI Small Cap Fund, which holds 4.42%. Individual investors collectively own 14.51% of the company.

View full answer

What is the bonus history of the Indiamart Inter.?

06-Jun-2025

Indiamart Intermesh Ltd issued a 1:1 bonus share on June 21, 2023, meaning shareholders received one additional share for each share held. The record date for this bonus was also June 21, 2023.

Indiamart Intermesh Ltd has a recent bonus history that includes a 1:1 bonus issue, which was announced with an ex-date of June 21, 2023. This means that for every share held, shareholders received an additional share. The record date for this bonus was also June 21, 2023. If you have any further questions about the company or its financials, feel free to ask!

View full answer

Has Indiamart Inter. declared dividend?

06-Jun-2025

Yes, Indiamart Intermesh Ltd has declared a dividend of 300%, amounting to ₹20 per share, with an ex-date of June 6, 2025. While total returns have fluctuated over various periods, the company has shown a strong positive return of 114.35% over the last five years.

Indiamart Intermesh Ltd has declared a dividend.<BR><BR>Dividend Details:<BR>- Percentage announced: 300%<BR>- Amount per share: 20<BR>- Ex-date: 06 Jun 25<BR><BR>Dividend Yield: 0.82%<BR><BR>Total Returns by Period:<BR>In the last 6 months, the price return was 2.06%, the dividend return was 1.26%, resulting in a total return of 3.32%.<BR><BR>Over the past year, the price return was -5.43%, the dividend return was 1.17%, leading to a total return of -4.26%.<BR><BR>In the last 2 years, the price return was -14.17%, the dividend return was 1.69%, which resulted in a total return of -12.48%.<BR><BR>For the 3-year period, the price return was 8.75%, the dividend return was 3.52%, culminating in a total return of 12.27%.<BR><BR>Over the past 4 years, the price return was -30.56%, the dividend return was 2.47%, resulting in a total return of -28.09%.<BR><BR>In the last 5 years, the price return was 106.14%, the dividend return was 8.21%, leading to a total return of 114.35%.<BR><BR>Overall, Indiamart Intermesh Ltd has declared a substantial dividend, and while the total returns have varied significantly over different periods, the long-term performance shows a strong positive return in the last five years, indicating potential growth despite some negative returns in shorter periods.

View full answer
iScoreScore
Click here to find our call on this stock
Strong Sell
Sell
Hold
Buy
Strong Buy

Dashboard

1

Poor long term growth as Operating profit has grown by an annual rate 9.41% of over the last 5 years

 
2

With ROE of 19.8, it has a Expensive valuation with a 4.4 Price to Book Value

3

Consistent Underperformance against the benchmark over the last 3 years

stock-summaryMojo Parameters

Mojo Parameters

Loading Valuation Snapshot...

Stock DNA

stock-summary
Industry

E-Retail/ E-Commerce

stock-summary
Market cap

INR 10,564 Cr (Small Cap)

stock-summary
P/E

21.00

stock-summary
Industry P/E

21

stock-summary
Dividend Yield

3.42%

stock-summary
Debt Equity

-1.29

stock-summary
Return on Equity

19.78%

stock-summary
Price to Book

4.39

Revenue and Profits:
Net Sales:
414 Cr
(Quarterly Results - Jun 2026)
Net Profit:
172 Cr
stock-summaryTotal Returns
Total Returns (Price + Dividend) stock-summary
Dividend Yield (3.42%)
TimePeriod
Price Return
Dividend Return
Total Return
3 Months
-13.85%
1.50%
-12.35%
6 Months
-19.51%
1.41%
-18.1%
1 Year
-33.94%
1.15%
-32.79%
2 Years
-40.62%
1.98%
-38.64%
3 Years
-41.74%
2.51%
-39.23%
4 Years
-19.76%
4.00%
-15.76%
5 Years
-50.37%
2.21%
-48.16%

Latest dividend: 30 per share ex-dividend date: Jun-19-2026

Risk Adjusted Returns v/s stock-summary
Returns Beta
Icon
Beta has not been calculated since enough price history is not available
stock-summaryNews & Corporate Actions

Announcements stock-summary

Announcement under Regulation 30 (LODR)-Analyst / Investor Meet - Outcome

24-Aug-2026 | Source : BSE

Please find enclosed outcome of Analyst/Institutional investor meet/call.

Announcement under Regulation 30 (LODR)-Analyst / Investor Meet - Outcome

20-Aug-2026 | Source : BSE

Please find enclosed outcome of Analyst/Institutional investor meet/call.

Announcement under Regulation 30 (LODR)-Analyst / Investor Meet - Outcome

17-Aug-2026 | Source : BSE

Please find enclosed outcome of Analyst/Institutional investor meet/call.

Corporate Actions stock-summary

stock-summary
BOARD MEETING

No Upcoming Board Meetings

stock-summary
DIVIDEND

Indiamart Intermesh Ltd has declared 300% dividend, ex-date: 19 Jun 26

stock-summary
SPLITS

No Splits history available

stock-summary
BONUS

Indiamart Intermesh Ltd has announced 1:1 bonus issue, ex-date: 21 Jun 23

stock-summary
RIGHTS

No Rights history available

stock-summaryKey Factors

Quality key factors stock-summary

Factor
Value
Sales Growth (5y)
18.21%
EBIT Growth (5y)
9.41%
EBIT to Interest (avg)
80.51
Debt to EBITDA (avg)
0.13
Net Debt to Equity (avg)
-1.29
Sales to Capital Employed (avg)
0.57
Tax Ratio
26.98%
Dividend Payout Ratio
75.95%
Pledged Shares
0
Institutional Holding
32.03%
ROCE (avg)
-178.26%
ROE (avg)
18.79%

Valuation key factors

Factor
Value
P/E Ratio
21
Industry P/E
21
Price to Book Value
4.39
EV to EBIT
14.45
EV to EBITDA
13.71
EV to Capital Employed
-10.68
EV to Sales
4.62
PEG Ratio
NA
Dividend Yield
3.42%
ROCE (Latest)
Negative Capital Employed
ROE (Latest)
19.78%

Technicals key factors

Indicator
Weekly
Monthly
MACD
Bearish
Bearish
RSI
No Signal
No Signal
Bollinger Bands
Mildly Bearish
Bearish
Moving Averages
Bearish (Daily)
KST
Bearish
Bearish
Dow Theory
Mildly Bearish
Mildly Bearish
OBV
No Trend
Mildly Bearish
stock-summary Technical Indicator Scale: Bearish, Mildly Bearish, Sideways, Mildly Bullish, Bullish  Turned 
stock-summaryShareholding
Shareholding Snapshot : Jun 2026stock-summary
Shareholding Compare (%holding) stock-summary
Majority shareholders

Promoters

Pledged Promoter Holdings

None

Mutual Funds

Held by 21 Schemes (10.44%)

FIIs

Held by 174 FIIs (19.92%)

Promoter with highest holding

Dinesh Chandra Agarwal (27.98%)

Highest Public shareholder

Nalanda India Equity Fund Limited (7.54%)

Individual Investors Holdings

16.1%

stock-summaryFinancial
[
  {
    "link": "quarterly",
    "btn_text": "All Quarterly Results",
    "header": "Quarterly Results Snapshot (Consolidated) - Jun'26 - QoQ",
    "rhs": [
      {
        "prefix": "Net Sales ",
        "suffix": "QoQ Growth in quarter ended Jun 2026 is 2.50% vs 0.67% in Mar 2026",
        "dir": 1
      },
      {
        "prefix": "Consolidated Net Profit ",
        "suffix": "QoQ Growth in quarter ended Jun 2026 is 243.03% vs -73.34% in Mar 2026",
        "dir": 1
      }
    ],
    "table": {
      "header": [
        "Jun'26",
        "Mar'26",
        "Change(%)"
      ],
      "body": [
        {
          "field": "Net Sales",
          "val1": "414.40",
          "val2": "404.30",
          "chgp": "2.50%",
          "chgp_class": "positive"
        },
        {
          "field": "Operating Profit (PBDIT) excl Other Income",
          "val1": "146.50",
          "val2": "132.60",
          "chgp": "10.48%",
          "chgp_class": "positive"
        },
        {
          "field": "Interest",
          "val1": "0.50",
          "val2": "0.60",
          "chgp": "-16.67%",
          "chgp_class": "positive"
        },
        {
          "field": "Exceptional Items",
          "val1": "0.00",
          "val2": "0.00",
          "chgp": "",
          "chgp_class": "neutral"
        },
        {
          "field": "Consolidate Net Profit",
          "val1": "172.20",
          "val2": "50.20",
          "chgp": "243.03%",
          "chgp_class": "positive"
        },
        {
          "field": "Operating Profit Margin (Excl OI)",
          "val1": "35.35%",
          "val2": "32.80%",
          "chgp": "2.55%",
          "chgp_class": "positive"
        }
      ]
    }
  },
  {
    "link": "half-yearly",
    "btn_text": "All Half Yearly Results",
    "header": "Half Yearly Results Snapshot (Consolidated) - Sep'25",
    "rhs": [
      {
        "prefix": "Net Sales ",
        "suffix": " Growth in half year ended Sep 2025 is 12.39% vs 17.72% in Sep 2024",
        "dir": -1
      },
      {
        "prefix": "Consolidated Net Profit ",
        "suffix": " Growth in half year ended Sep 2025 is -5.18% vs 63.34% in Sep 2024",
        "dir": -1
      }
    ],
    "table": {
      "header": [
        "Sep'25",
        "Sep'24",
        "Change(%)"
      ],
      "body": [
        {
          "field": "Net Sales",
          "val1": "763.10",
          "val2": "679.00",
          "chgp": "12.39%",
          "chgp_class": "positive"
        },
        {
          "field": "Operating Profit (PBDIT) excl Other Income",
          "val1": "263.20",
          "val2": "254.10",
          "chgp": "3.58%",
          "chgp_class": "positive"
        },
        {
          "field": "Interest",
          "val1": "1.70",
          "val2": "3.90",
          "chgp": "-56.41%",
          "chgp_class": "positive"
        },
        {
          "field": "Exceptional Items",
          "val1": "0.00",
          "val2": "0.00",
          "chgp": "",
          "chgp_class": "neutral"
        },
        {
          "field": "Consolidate Net Profit",
          "val1": "236.20",
          "val2": "249.10",
          "chgp": "-5.18%",
          "chgp_class": "negative"
        },
        {
          "field": "Operating Profit Margin (Excl OI)",
          "val1": "34.49%",
          "val2": "37.42%",
          "chgp": "-2.93%",
          "chgp_class": "negative"
        }
      ]
    }
  },
  {
    "link": "nine-monthly",
    "btn_text": "All Nine Monthly Results",
    "header": "Nine Monthly Results Snapshot (Consolidated) - Dec'25",
    "rhs": [
      {
        "prefix": "Net Sales ",
        "suffix": "YoY Growth in nine months ended Dec 2025 is 12.72% vs 17.14% in Dec 2024",
        "dir": -1
      },
      {
        "prefix": "Consolidated Net Profit ",
        "suffix": "YoY Growth in nine months ended Dec 2025 is 14.70% vs 57.89% in Dec 2024",
        "dir": -1
      }
    ],
    "table": {
      "header": [
        "Dec'25",
        "Dec'24",
        "Change(%)"
      ],
      "body": [
        {
          "field": "Net Sales",
          "val1": "1,164.70",
          "val2": "1,033.30",
          "chgp": "12.72%",
          "chgp_class": "positive"
        },
        {
          "field": "Operating Profit (PBDIT) excl Other Income",
          "val1": "397.40",
          "val2": "392.40",
          "chgp": "1.27%",
          "chgp_class": "positive"
        },
        {
          "field": "Interest",
          "val1": "2.40",
          "val2": "5.70",
          "chgp": "-57.89%",
          "chgp_class": "positive"
        },
        {
          "field": "Exceptional Items",
          "val1": "0.00",
          "val2": "0.00",
          "chgp": "",
          "chgp_class": "neutral"
        },
        {
          "field": "Consolidate Net Profit",
          "val1": "424.50",
          "val2": "370.10",
          "chgp": "14.70%",
          "chgp_class": "positive"
        },
        {
          "field": "Operating Profit Margin (Excl OI)",
          "val1": "34.12%",
          "val2": "37.98%",
          "chgp": "-3.86%",
          "chgp_class": "negative"
        }
      ]
    }
  },
  {
    "link": "annual",
    "btn_text": "All Annual Results",
    "header": "Annual Results Snapshot (Consolidated) - Mar'26",
    "rhs": [
      {
        "prefix": "Net Sales ",
        "suffix": "YoY Growth in year ended Mar 2026 is 13.01% vs 16.01% in Mar 2025",
        "dir": -1
      },
      {
        "prefix": "Consolidated Net Profit ",
        "suffix": "YoY Growth in year ended Mar 2026 is -13.80% vs 64.88% in Mar 2025",
        "dir": -1
      }
    ],
    "table": {
      "header": [
        "Mar'26",
        "Mar'25",
        "Change(%)"
      ],
      "body": [
        {
          "field": "Net Sales",
          "val1": "1,569.00",
          "val2": "1,388.40",
          "chgp": "13.01%",
          "chgp_class": "positive"
        },
        {
          "field": "Operating Profit (PBDIT) excl Other Income",
          "val1": "530.00",
          "val2": "522.80",
          "chgp": "1.38%",
          "chgp_class": "positive"
        },
        {
          "field": "Interest",
          "val1": "3.00",
          "val2": "7.40",
          "chgp": "-59.46%",
          "chgp_class": "positive"
        },
        {
          "field": "Exceptional Items",
          "val1": "0.00",
          "val2": "0.00",
          "chgp": "",
          "chgp_class": "neutral"
        },
        {
          "field": "Consolidate Net Profit",
          "val1": "474.70",
          "val2": "550.70",
          "chgp": "-13.80%",
          "chgp_class": "negative"
        },
        {
          "field": "Operating Profit Margin (Excl OI)",
          "val1": "33.78%",
          "val2": "37.65%",
          "chgp": "-3.87%",
          "chgp_class": "negative"
        }
      ]
    }
  }
]

Quarterly Results Snapshot (Consolidated) - Jun'26 - QoQstock-summary

Jun'26
Mar'26
Change(%)
Net Sales
414.40
404.30
2.50%
Operating Profit (PBDIT) excl Other Income
146.50
132.60
10.48%
Interest
0.50
0.60
-16.67%
Exceptional Items
0.00
0.00
Consolidate Net Profit
172.20
50.20
243.03%
Operating Profit Margin (Excl OI)
35.35%
32.80%
2.55%
Values in Rs Cr.
Direction Arrows
Net Sales

QoQ Growth in quarter ended Jun 2026 is 2.50% vs 0.67% in Mar 2026

Direction Arrows
Consolidated Net Profit

QoQ Growth in quarter ended Jun 2026 is 243.03% vs -73.34% in Mar 2026

Half Yearly Results Snapshot (Consolidated) - Sep'25stock-summary

Sep'25
Sep'24
Change(%)
Net Sales
763.10
679.00
12.39%
Operating Profit (PBDIT) excl Other Income
263.20
254.10
3.58%
Interest
1.70
3.90
-56.41%
Exceptional Items
0.00
0.00
Consolidate Net Profit
236.20
249.10
-5.18%
Operating Profit Margin (Excl OI)
34.49%
37.42%
-2.93%
Values in Rs Cr.
Direction Arrows
Net Sales

Growth in half year ended Sep 2025 is 12.39% vs 17.72% in Sep 2024

Direction Arrows
Consolidated Net Profit

Growth in half year ended Sep 2025 is -5.18% vs 63.34% in Sep 2024

Nine Monthly Results Snapshot (Consolidated) - Dec'25stock-summary

Dec'25
Dec'24
Change(%)
Net Sales
1,164.70
1,033.30
12.72%
Operating Profit (PBDIT) excl Other Income
397.40
392.40
1.27%
Interest
2.40
5.70
-57.89%
Exceptional Items
0.00
0.00
Consolidate Net Profit
424.50
370.10
14.70%
Operating Profit Margin (Excl OI)
34.12%
37.98%
-3.86%
Values in Rs Cr.
Direction Arrows
Net Sales

YoY Growth in nine months ended Dec 2025 is 12.72% vs 17.14% in Dec 2024

Direction Arrows
Consolidated Net Profit

YoY Growth in nine months ended Dec 2025 is 14.70% vs 57.89% in Dec 2024

Annual Results Snapshot (Consolidated) - Mar'26stock-summary

Mar'26
Mar'25
Change(%)
Net Sales
1,569.00
1,388.40
13.01%
Operating Profit (PBDIT) excl Other Income
530.00
522.80
1.38%
Interest
3.00
7.40
-59.46%
Exceptional Items
0.00
0.00
Consolidate Net Profit
474.70
550.70
-13.80%
Operating Profit Margin (Excl OI)
33.78%
37.65%
-3.87%
Values in Rs Cr.
Direction Arrows
Net Sales

YoY Growth in year ended Mar 2026 is 13.01% vs 16.01% in Mar 2025

Direction Arrows
Consolidated Net Profit

YoY Growth in year ended Mar 2026 is -13.80% vs 64.88% in Mar 2025

stock-summaryCompany CV
About Indiamart Intermesh Ltd stock-summary
stock-summary
Indiamart Intermesh Ltd
Small Cap
E-Retail/ E-Commerce
Indiamart Intermesh Limited was incorporated as a Public limited Company on September 13, 1999. The Company received the certificate for commencement of business from the RoC on October 27, 1999. Prior to incorporating the Company, Dinesh Chandra Agarwal, and one of the Promoter, engaged in the business of operating the website www.indiamart.com through InterMESH Systems, a sole proprietorship firm.
Company Coordinates stock-summary
Company Details
1st Floor 29-Daryaganj, Netaji Subash Marg New Delhi New Delhi : 110002
stock-summary
Tel: 91-11-30272100
stock-summary
cs@indiamart.com
Registrar Details