
Compare Indian Acrylics with Similar Stocks
Dashboard
With a Negative Book Value, the company has a Weak Long Term Fundamental Strength
- Poor long term growth as Net Sales has grown by an annual rate of -7.74% and Operating profit at 11.89% over the last 5 years
- Low ability to service debt as the company has a high Debt to EBITDA ratio of -173.51 times
Negative results in Mar 26
Risky - Negative EBITDA
26.36% of Promoter Shares are Pledged
Consistent Underperformance against the benchmark over the last 3 years
Stock DNA
Petrochemicals
INR 81 Cr (Micro Cap)
NA (Loss Making)
23
0.00%
-17.43
194.75%
-6.44
Total Returns (Price + Dividend) 
Indian Acrylics for the last several years.
Risk Adjusted Returns v/s
Returns Beta

News
Are Indian Acrylics Ltd latest results good or bad?
The latest financial results for Indian Acrylics Ltd reveal significant challenges in its operational performance. In Q4 FY26, the company reported net sales of ₹74.00 crores, which represents a notable decline of 17.13% from the previous quarter and a 10.76% decrease year-on-year. This marks the lowest revenue figure in the last eight quarters, indicating persistent demand challenges or potential losses in market share within the acrylic fibre segment. The operating profit margins turned negative at -8.59%, a substantial drop from the marginally positive margin of 0.30% in Q4 FY25. This indicates that the company is selling its products below cost, raising serious concerns about its pricing power and operational efficiency. The negative operating profit before depreciation, interest, tax, and other income of ₹-6.36 crores further underscores the operational difficulties faced by the company. Additionally...
Read full news article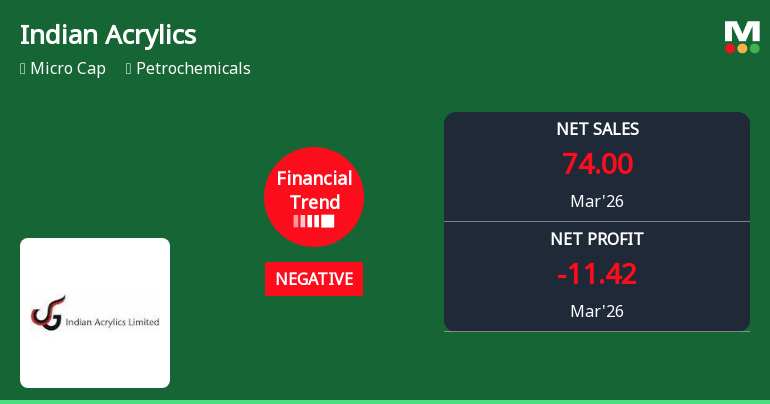
Indian Acrylics Ltd Reports Sharp Decline in Quarterly Performance Amid Negative Financial Trend
Indian Acrylics Ltd, a micro-cap player in the petrochemicals sector, has reported a significant downturn in its financial performance for the quarter ended March 2026. The company’s financial trend has shifted from flat to negative, with key metrics such as profit after tax, operating profit, and net sales registering steep declines compared to previous quarters. This deterioration has prompted a downgrade in its Mojo Grade to Strong Sell, reflecting heightened concerns over its near-term prospects.
Read full news article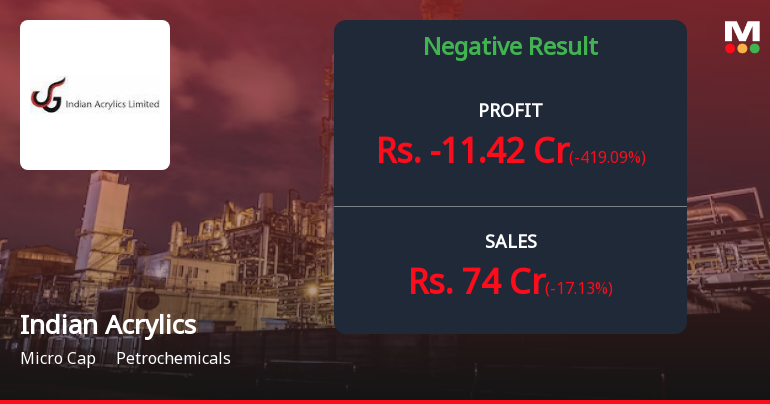
Indian Acrylics Q4 FY26: Losses Deepen Amid Operational Turmoil
Indian Acrylics Ltd., a micro-cap acrylic fibre manufacturer based in Punjab, reported a catastrophic fourth quarter for FY2026, with net losses ballooning to ₹11.42 crores—a staggering 100.70% deterioration compared to the ₹5.69 crore loss in Q4 FY25. The company's market capitalisation stands at a modest ₹79.00 crores, with shares trading at ₹5.85 following a 3.15% decline in the most recent session, reflecting investor anxiety over mounting operational challenges.
Read full news article Announcements
Announcement under Regulation 30 (LODR)-Newspaper Publication
30-May-2026 | Source : BSENewspaper cutting of extract of audited financial results for the quarter and year ended 31.03.2026.
Audited Financial Results For The Quarter And Year Ended 31.03.2026
29-May-2026 | Source : BSEStandalone and Consolidated audited financial results for the quarter and year ended 31.03.2026 alongwith audite report
Board Meeting Outcome for Outcome Of Board Meeting Held On 29.05.2026
29-May-2026 | Source : BSEOutcome of Board meeting held on 29.05.2026
Corporate Actions

No Upcoming Board Meetings

No Dividend history available

No Splits history available

No Bonus history available

No Rights history available
Quality key factors
Valuation key factors
Technicals key factors
 Technical Indicator Scale: Bearish, Mildly Bearish, Sideways, Mildly Bullish, Bullish Turned
 Shareholding Snapshot : Mar 2026
Shareholding Compare (%holding)
Promoters
26.3624
Held by 4 Schemes (0.07%)
Held by 0 FIIs
Dheeraj Garg (16.49%)
None
34.5%
Quarterly Results Snapshot (Consolidated) - Mar'26 - QoQ

QoQ Growth in quarter ended Mar 2026 is -17.13% vs -12.61% in Dec 2025
QoQ Growth in quarter ended Mar 2026 is -419.09% vs 61.74% in Dec 2025
Half Yearly Results Snapshot (Consolidated) - Sep'25

Growth in half year ended Sep 2025 is -10.32% vs -32.15% in Sep 2024
Growth in half year ended Sep 2025 is 48.32% vs 40.52% in Sep 2024
Nine Monthly Results Snapshot (Consolidated) - Dec'25
YoY Growth in nine months ended Dec 2025 is -9.38% vs -30.33% in Dec 2024
YoY Growth in nine months ended Dec 2025 is 49.68% vs 39.63% in Dec 2024
Annual Results Snapshot (Consolidated) - Mar'26
YoY Growth in year ended Mar 2026 is -9.67% vs -28.72% in Mar 2025
YoY Growth in year ended Mar 2026 is 21.96% vs 42.89% in Mar 2025
About Indian Acrylics Ltd

Company Coordinates


