
Compare Indian CardCloth with Similar Stocks
Dashboard
With a Operating Losses, the company has a Weak Long Term Fundamental Strength
- Company's ability to service its debt is weak with a poor EBIT to Interest (avg) ratio of -6.54
- The company has reported losses. Due to this company has reported negative ROCE
The company has declared Negative results for the last 3 consecutive quarters
Risky - Negative EBITDA
Underperformed the market in the last 1 year
Stock DNA
Garments & Apparels
INR 127 Cr (Micro Cap)
26.00
86
0.00%
-0.25
1.41%
0.37
Total Returns (Price + Dividend) 
Latest dividend: 25 per share ex-dividend date: Jul-07-2022
Risk Adjusted Returns v/s
Returns Beta

News
Indian Card Clothing Company Ltd is Rated Strong Sell
Indian Card Clothing Company Ltd is rated Strong Sell by MarketsMOJO. This rating was last updated on 18 Aug 2025, reflecting a significant reassessment of the stock’s outlook. However, the analysis and financial metrics discussed here represent the company’s current position as of 01 June 2026, providing investors with the latest insights into its performance and prospects.
Read full news articleAre Indian Card Clothing Company Ltd latest results good or bad?
The latest financial results for Indian Card Clothing Company Ltd for the quarter ended March 2026 reveal a complex operational landscape. The company reported a net profit of -₹3.38 crores, reflecting a significant decline compared to the previous year, marking the seventh consecutive quarter of operational losses. This indicates persistent challenges in achieving profitability within its core operations. Despite a year-on-year revenue growth of 9.98%, reaching ₹11.24 crores, the operational performance remains under pressure, with an operating profit before depreciation, interest, tax, and other income (PBDIT excluding OI) showing a loss of ₹3.92 crores. The operating margin, at -34.88%, suggests that the company continues to struggle with its cost structure, particularly high employee expenses, which accounted for over 45% of net sales. The return on equity (ROE) stands at 2.97%, indicating below-avera...
Read full news article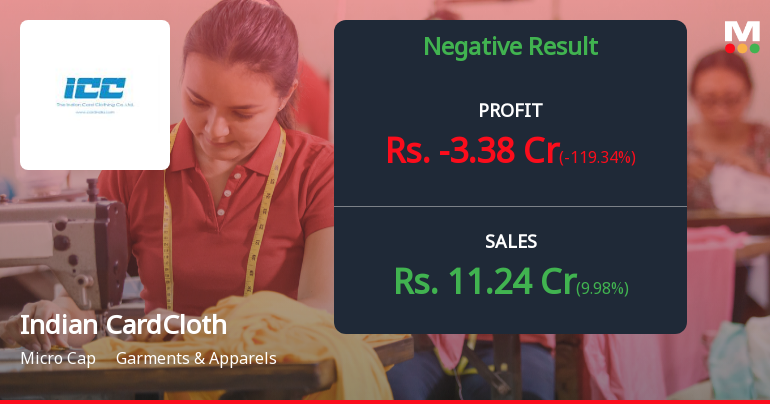
Indian Card Clothing Q4 FY26: Operational Losses Deepen Amid Revenue Stagnation
Indian Card Clothing Company Ltd., a micro-cap player in the garments and apparels sector with a market capitalisation of ₹139.00 crores, reported a challenging quarter ending March 2026, posting a consolidated net loss of ₹3.38 crores compared to a profit of ₹17.48 crores in the corresponding quarter last year. The 119.34% year-on-year decline in profitability underscores persistent operational challenges that continue to plague the company's core card clothing business. Following the results announcement, the stock has declined 34.45% over the past year, significantly underperforming the Sensex's 8.40% decline and the garments and apparels sector's 11.94% fall.
Read full news article Announcements
Board Meeting Outcome for Outcome Of The Board Meeting Of The Company Held On May 29 2026
29-May-2026 | Source : BSEAnnual Audited Standalone and Consolidated Financial Results of the Company for the quarter and year ended March 31 2026
Annual Audited Standalone And Consolidated Financial Results Of The Company For The Quarter And Year Ended March 31 2026
29-May-2026 | Source : BSEAnnual Audited Standalone and Consolidated Financial Results of the Company for the quater and year ended March 31 2026
Compliances-Reg.24(A)-Annual Secretarial Compliance
27-May-2026 | Source : BSEAnnual Secretarial Compliance Report for the year ended March 31 2026
Corporate Actions

No Upcoming Board Meetings

Indian Card Clothing Company Ltd has declared 250% dividend, ex-date: 07 Jul 22

No Splits history available

No Bonus history available

No Rights history available
Quality key factors
Valuation key factors
Technicals key factors
 Technical Indicator Scale: Bearish, Mildly Bearish, Sideways, Mildly Bullish, Bullish Turned
 Shareholding Snapshot : Mar 2026
Shareholding Compare (%holding)
Promoters
None
Held by 0 Schemes
Held by 0 FIIs
Multi-act Industrial Enterprises Limited (67.33%)
None
27.88%
Quarterly Results Snapshot (Consolidated) - Mar'26 - YoY

YoY Growth in quarter ended Mar 2026 is 9.98% vs -16.71% in Mar 2025

YoY Growth in quarter ended Mar 2026 is -119.34% vs 1,097.26% in Mar 2025
Half Yearly Results Snapshot (Consolidated) - Sep'25
Growth in half year ended Sep 2025 is -4.09% vs -30.44% in Sep 2024
Growth in half year ended Sep 2025 is -89.67% vs 917.03% in Sep 2024
Nine Monthly Results Snapshot (Consolidated) - Dec'25
YoY Growth in nine months ended Dec 2025 is -3.21% vs -26.33% in Dec 2024
YoY Growth in nine months ended Dec 2025 is -90.46% vs 1,042.86% in Dec 2024
Annual Results Snapshot (Consolidated) - Mar'26
YoY Growth in year ended Mar 2026 is 0.00% vs -24.22% in Mar 2025
YoY Growth in year ended Mar 2026 is -95.95% vs 1,052.70% in Mar 2025
About Indian Card Clothing Company Ltd

Company Coordinates


