Indian Hume Pipe

  • Market Cap: Small Cap
  • Industry: Industrial Manufacturing
  • ISIN: INE323C01030
  • NSEID: INDIANHUME
  • BSEID: 504741
INR
311.20
-5.35 (-1.69%)
BSENSE

May 29

BSE+NSE Vol: 59.41 k

  • Price Points
  • Score
  • Mojo Parameters
  • Total Return
  • News and Corporate Actions
  • Key factors
  • Shareholding
  • Financials
  • CompanyCV
stock-summaryPrice Point
High/Low

1Day

52 Week

Valuation
Technical
Day's Volume

CASH

59.41 k (17.21%) Volume

Shareholding (Mar 2026)

FII

0.39%

Held by 23 FIIs

DII

2.20%

Held by 2 DIIs

Promoter

72.34%

how big is Indian Hume Pipe?

06-Jun-2025

As of Jun 06, Indian Hume Pipe Company Ltd has a market capitalization of 2,268.74 Cr, classifying it as a Small Cap company, with net sales of 1,491.23 Cr and a net profit of 558.06 Cr over the latest four quarters. Shareholder's funds are valued at 829.26 Cr, and total assets amount to 2,077.23 Cr as of Mar'24.

Market Cap: As of Jun 06, Indian Hume Pipe Company Ltd has a market capitalization of 2,268.74 Cr, which classifies it as a Small Cap company.<BR><BR>Recent Quarterly Performance: The sum of Net Sales for the latest 4 quarters, which is Standalone data, amounts to 1,491.23 Cr. The sum of Net Profit for the same period is 558.06 Cr.<BR><BR>Balance Sheet Snapshot: This is Standalone data for the reporting period ending in Mar'24. Shareholder's Funds are valued at 829.26 Cr, while Total Assets stand at 2,077.23 Cr.

View full answer

What does Indian Hume Pipe do?

06-Jun-2025

Indian Hume Pipe Company Ltd manufactures pipes and related products, operating in the Industrial Manufacturing sector. As of March 2025, it reported net sales of ₹392 Cr and a net profit of ₹499 Cr, with a market cap of ₹2,256 Cr.

Overview: <BR>Indian Hume Pipe Company Ltd is a manufacturer of various types of pipes and related products, operating in the Industrial Manufacturing sector and classified as a Small Cap company.<BR><BR>History: <BR>Incorporated in 1926, Indian Hume Pipe Company Ltd is part of the Walchand Harichand group. The latest quarterly results reported net sales and net profit for the period ending March 2025.<BR><BR>Financial Snapshot: <BR>Net Sales: 392 Cr (Quarterly Results - Mar 2025) <BR>Net Profit: 499 Cr (Quarterly Results - Mar 2025) <BR>Market Cap: Rs 2,256 Cr (Small Cap)<BR><BR>Key Metrics: <BR>P/E: 25.00 <BR>Industry P/E: 23 <BR>Dividend Yield: 0.34% <BR>Debt-Equity: 0.65 <BR>Return on Equity: 10.61% <BR>Price to Book: 2.66<BR><BR>Contact Details: <BR>Address: Construction House Ballard Est, 5 Walchand Hirachand Rd 2 Flr Mumbai Maharashtra : 400001 <BR>Tel: 91-022-22618091/92/40748181 <BR>Email: info@indianhumepipe.com <BR>Website: http://www.indianhumepipe.com

View full answer

What is the bonus history of the Indian Hume Pipe?

06-Jun-2025

The Indian Hume Pipe Company issued a 1:1 bonus on December 9, 2016, with a record date of December 13, 2016, granting shareholders one additional share for each share held.

The Indian Hume Pipe Company has a notable bonus history, with its most recent bonus issue being a 1:1 bonus announced on December 9, 2016. The record date for this bonus was December 13, 2016. This means that shareholders received one additional share for every share they held as of the record date.

View full answer

Has Indian Hume Pipe declared dividend?

06-Jun-2025

Yes, Indian Hume Pipe Company Ltd has declared a 75% dividend, amounting to ₹1.5 per share, with an ex-date of July 19, 2024. The company has shown strong total returns over various periods, particularly in the long term.

Indian Hume Pipe Company Ltd has declared a 75% dividend.<BR><BR>Dividend Details:<BR>- Percentage announced: 75%<BR>- Amount per share: 1.5<BR>- Ex-date: Jul-19-2024<BR><BR>Dividend Yield: 0.34%.<BR><BR>Total Returns by Period:<BR>In the last 6 months, the price return was -2.16%, with a dividend return of 0%, resulting in a total return of -2.16%.<BR><BR>Over the past year, there was a price return of 29.7% and a dividend return of 0.44%, leading to a total return of 30.14%.<BR><BR>In the 2-year period, the price return was 148.64%, with a dividend return of 1.27%, resulting in a total return of 149.91%.<BR><BR>For the 3-year period, the price return was 172.19% and the dividend return was 3.19%, culminating in a total return of 175.38%.<BR><BR>In the last 4 years, the price return was 93.08%, with a dividend return of 3.01%, leading to a total return of 96.09%.<BR><BR>Lastly, over the 5-year period, the price return was 177.12%, and the dividend return was 4.77%, resulting in a total return of 181.89%.<BR><BR>Overall, Indian Hume Pipe has declared a substantial dividend while also showing positive total returns over various periods, particularly notable in the longer-term returns, indicating a strong performance in terms of both price appreciation and dividend distribution.

View full answer

Who are the peers of the Indian Hume Pipe?

03-Jun-2025

Peers of Indian Hume Pipe include Kaynes Tech, Honeywell Auto, Jyoti CNC Auto, LMW, Jupiter Wagons, Hind Rectifiers, HMT, Rajoo Engineers, Disa India, and Thejo Engg. Indian Hume Pipe has average management risk and a 1-year return of 30.50%, lower than Hind Rectifiers' 100.75% but higher than Honeywell Auto's -26.32%.

Peers: The peers of Indian Hume Pipe are Kaynes Tech, Honeywell Auto, Jyoti CNC Auto., LMW, Jupiter Wagons, Hind Rectifiers, HMT, Rajoo Engineers, Disa India, and Thejo Engg.<BR><BR>Quality Snapshot: Excellent management risk is observed at Honeywell Auto, Jyoti CNC Auto., and Disa India, while Average management risk is found at Kaynes Tech, LMW, Jupiter Wagons, Hind Rectifiers, Indian Hume Pipe, Rajoo Engineers, and Thejo Engg. HMT does not qualify for management risk assessment. Growth is Excellent at Kaynes Tech and Jyoti CNC Auto., Good at Rajoo Engineers, Average at Indian Hume Pipe, LMW, and Jupiter Wagons, and Below Average at Honeywell Auto, Disa India, Hind Rectifiers, and Thejo Engg. Capital Structure is Excellent at Honeywell Auto, LMW, Jupiter Wagons, Rajoo Engineers, and Disa India, Good at Kaynes Tech and Jyoti CNC Auto., and Below Average at Hind Rectifiers, Indian Hume Pipe, and the rest.<BR><BR>Return Snapshot: Hind Rectifiers has the highest 1-year return at 100.75%, while Honeywell Auto has the lowest at -26.32%. Indian Hume Pipe's 1-year return of 30.50% is higher than Honeywell Auto's but lower than Hind Rectifiers'. Additionally, LMW, Jupiter Wagons, Rajoo Engineers, Disa India, and Thejo Engg. have negative six-month returns.

View full answer

Is Indian Hume Pipe overvalued or undervalued?

10-Jul-2025

As of July 9, 2025, Indian Hume Pipe is considered very attractive and undervalued, with a PE ratio of 25.65, strong ROCE of 15.82%, and a year-to-date return of 23.72%, outperforming the Sensex's 6.91%.

As of 9 July 2025, the valuation grade for Indian Hume Pipe has moved from attractive to very attractive, indicating a stronger position in the market. The company is currently assessed as undervalued. Key ratios include a PE ratio of 25.65, an EV to EBITDA of 11.74, and a PEG ratio of 1.40, which suggest that the stock is trading at a reasonable valuation compared to its earnings growth potential.<BR><BR>In comparison with peers, Indian Hume Pipe's PE ratio is higher than Ramco Industries, which has a PE of 13.65, but lower than Shankara Building, which stands at 31.3. This positions Indian Hume Pipe favorably within its industry, especially considering its robust ROCE of 15.82%. Additionally, the company's year-to-date return of 23.72% significantly outperformed the Sensex's 6.91%, reinforcing the positive valuation outlook.

View full answer

Who are in the management team of Indian Hume Pipe?

16-Jul-2025

As of March 2023, the management team of Indian Hume Pipe includes Rajas R Doshi (Chairman & Managing Director), Jyoti R Doshi, Rajendra M Gandhi, Anima B Kapadia, Vijay Kumar Jatia, S M Mandke (Company Secretary), Mayur R Doshi, Sucheta N Shah, and N S Damani. They oversee the company's operations and strategic direction.

As of March 2023, the management team of Indian Hume Pipe includes the following individuals:<BR><BR>1. Rajas R Doshi - Chairman & Managing Director<BR>2. Jyoti R Doshi - Non-Executive & Non-Independent Director<BR>3. Rajendra M Gandhi - Independent Director<BR>4. Anima B Kapadia - Non-Executive & Non-Independent Director<BR>5. Vijay Kumar Jatia - Independent Director<BR>6. S M Mandke - Company Secretary & Compliance Officer<BR>7. Mayur R Doshi - Executive Director<BR>8. Sucheta N Shah - Independent Director<BR>9. N S Damani - Independent Director<BR><BR>This team is responsible for overseeing the company's operations and strategic direction.

View full answer

Who are the top shareholders of the Indian Hume Pipe?

17-Jul-2025

The top shareholders of Indian Hume Pipe include Ihp Finvest Limited with 67.58%, mutual funds holding 2.09%, 27 foreign institutional investors with 0.56%, and individual investors at 19.67%, with Ymsh Management Consultants LLP being the largest public shareholder at 1.75%.

The top shareholders of Indian Hume Pipe include a mix of promoters, mutual funds, foreign institutional investors (FIIs), and individual investors. The majority of the shares are held by promoters, with Ihp Finvest Limited being the largest shareholder, holding 67.58% of the company. Additionally, there are two mutual fund schemes that collectively hold 2.09%, while 27 FIIs hold a combined 0.56%. The highest public shareholder is Ymsh Management Consultants LLP, which holds 1.75%. Individual investors account for 19.67% of the shareholding.

View full answer

How has been the historical performance of Indian Hume Pipe?

12-Nov-2025

Indian Hume Pipe's historical performance shows fluctuating net sales, peaking at 1,645.53 crore in Mar'19 and declining to 1,491.23 crore in Mar'25, while profits have significantly improved, with profit before tax rising to 663.29 crore in Mar'25 from 103.49 crore in Mar'24, indicating a positive trend in profitability and asset growth.

Answer:<BR>The historical performance of Indian Hume Pipe shows a fluctuating trend in net sales and profits over the years, with significant improvements in recent periods.<BR><BR>Breakdown:<BR>Indian Hume Pipe's net sales peaked at 1,645.53 crore in Mar'19 but have since shown a decline, reaching 1,491.23 crore in Mar'25. The total operating income followed a similar pattern, with a high of 1,645.53 crore in Mar'19 and a decrease to 1,491.23 crore in Mar'25. The company's operating profit (PBDIT) has improved from 134.15 crore in Mar'23 to 195.11 crore in Mar'25, indicating a recovery in operational efficiency. Profit before tax surged to 663.29 crore in Mar'25, a significant increase from 103.49 crore in Mar'24, while profit after tax also rose sharply to 558.05 crore in Mar'25 from 77.63 crore in Mar'24. The company's total assets increased from 2,077.23 crore in Mar'24 to 2,729.21 crore in Mar'25, reflecting growth in both current and non-current assets. Total liabilities also rose, but the increase in shareholder's funds from 829.26 crore in Mar'24 to 1,376.67 crore in Mar'25 suggests a strengthening balance sheet. Cash flow from operating activities remained positive at 203 crore in Mar'25, contributing to a net cash inflow of 28 crore, marking a recovery from previous outflows. Overall, the financial metrics indicate a positive trend in profitability and asset growth for Indian Hume Pipe in the latest fiscal year.

View full answer

Is Indian Hume Pipe technically bullish or bearish?

03-Dec-2025

As of December 2, 2025, the market trend is neutral with mixed signals, showing a sideways movement due to conflicting indicators, including mildly bullish weekly MACD and bearish weekly RSI.

As of 2 December 2025, the technical trend has changed from mildly bearish to sideways. The current stance is neutral, with mixed signals across different indicators. The weekly MACD is mildly bullish, while the monthly MACD is mildly bearish. The weekly RSI is bearish, indicating weakness, but the monthly RSI shows no signal. Bollinger Bands are bullish on both weekly and monthly time frames, suggesting potential upward movement. Moving averages on the daily chart are mildly bearish, which contrasts with the weekly KST and OBV, both of which are mildly bullish. Overall, the mixed indicators suggest a sideways movement with no strong bullish or bearish momentum at this time.

View full answer

When is the next results date for Indian Hume Pipe Company Ltd?

07-May-2026

The next results date for Indian Hume Pipe Company Ltd is 14 May 2026.

The next results date for Indian Hume Pipe Company Ltd is scheduled for 14 May 2026.

View full answer

Are Indian Hume Pipe Company Ltd latest results good or bad?

15-May-2026

The latest results for Indian Hume Pipe Company Ltd are concerning, showing a 10.41% year-on-year revenue decline despite a 24.55% sequential recovery, and a drastic 95.40% drop in net profit. The company faces ongoing operational challenges, highlighted by weak return ratios and reliance on non-operating income.

The latest results for Indian Hume Pipe Company Ltd indicate a challenging situation. While there was a sequential revenue recovery of 24.55% in Q4 FY26, bringing revenue to ₹351.30 crores, this still represents a decline of 10.41% year-on-year compared to ₹392.10 crores in Q4 FY25. This marks the third consecutive quarter of year-on-year revenue contraction, highlighting ongoing demand challenges in the infrastructure pipe sector.<BR><BR>Net profit for the quarter was ₹22.98 crores, which is a significant drop of 95.40% year-on-year and down 62.63% from the previous quarter. This sharp decline raises concerns about the sustainability of profitability, especially since a substantial portion of the profit was supported by other income, which accounted for 33.66% of profit before tax.<BR><BR>Operating margins improved sequentially to 10.91%, up from 7.85% in Q3 FY26, but this is still down from 14.28% in Q4 FY25, indicating ongoing pressures from rising input costs and competitive pricing.<BR><BR>Overall, the financial performance suggests underlying weaknesses, with weak return ratios and a heavy reliance on non-operating income. The company's return on equity (ROE) of 7.39% is below industry standards, reflecting poor capital efficiency. Given these factors, the results can be characterized as concerning, indicating that the company is facing significant operational challenges despite some short-term revenue recovery.

View full answer

Should I buy, sell or hold Indian Hume Pipe Company Ltd?

15-May-2026

Why is Indian Hume Pipe Company Ltd falling/rising?

29-May-2026

As of 28-May, the stock price of Indian Hume Pipe Company Ltd is at Rs 316.25, down 2.07%, following a trend reversal after four days of gains. The stock has significantly underperformed with a year-to-date decline of 22.51% and weak fundamentals, leading to bearish investor sentiment.

As of 28-May, the stock price of Indian Hume Pipe Company Ltd is falling, currently at Rs 316.25, reflecting a decrease of Rs 6.7 or 2.07%. This decline is notable as it follows a trend reversal after four consecutive days of gains. The stock has underperformed its sector by 2.42% today and has touched an intraday low of Rs 316, indicating a significant drop of 2.15%.<BR><BR>In terms of performance over various periods, the stock has shown a year-to-date decline of 22.51% and a one-year decline of 26.54%, which is substantially worse than the broader market, as represented by the Sensex, which has only fallen by 10.97% over the same period. Additionally, the stock's recent performance has been characterized by weak fundamentals, including a high Debt to EBITDA ratio of 2.46 times, indicating a low ability to service debt. The company's profitability is also concerning, with a Return on Equity (ROE) of only 6.7% and a CAGR growth in operating profits of just 4.01% over the last five years.<BR><BR>Recent financial results have further contributed to the stock's decline, with significant drops in profit before tax, profit after tax, and net sales in the latest quarterly report. Specifically, profit before tax fell by 39.34%, profit after tax decreased by 30.4%, and net sales dropped by 10.41%. These negative results, combined with the stock's overall underperformance compared to the market, have led to a bearish sentiment among investors, contributing to the current decline in stock price.

View full answer
iScoreScore
Click here to find our call on this stock
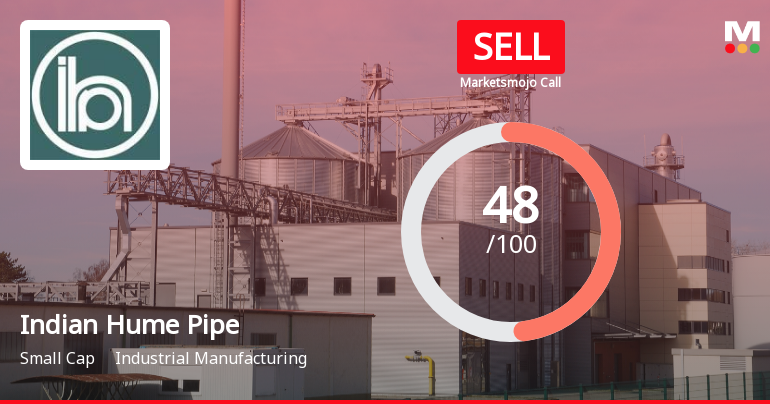
Strong Sell
Sell
Hold
Buy
Strong Buy

Dashboard

1

Weak Long Term Fundamental Strength with a 4.01% CAGR growth in Operating Profits over the last 5 years

  • Low ability to service debt as the company has a high Debt to EBITDA ratio of 2.46 times
  • The company has been able to generate a Return on Equity (avg) of 7.98% signifying low profitability per unit of shareholders funds
2

Negative results in Mar 26

3

Underperformed the market in the last 1 year

stock-summaryMojo Parameters

Mojo Parameters

Loading Valuation Snapshot...

Stock DNA

stock-summary
Industry

Industrial Manufacturing

stock-summary
Market cap

INR 1,674 Cr (Small Cap)

stock-summary
P/E

18.00

stock-summary
Industry P/E

13

stock-summary
Dividend Yield

1.83%

stock-summary
Debt Equity

-0.12

stock-summary
Return on Equity

6.66%

stock-summary
Price to Book

1.21

Revenue and Profits:
Net Sales:
351 Cr
(Quarterly Results - Mar 2026)
Net Profit:
23 Cr
stock-summaryTotal Returns
Total Returns (Price + Dividend) stock-summary
Dividend Yield (1.83%)
TimePeriod
Price Return
Dividend Return
Total Return
3 Months
-6.42%
0%
-6.42%
6 Months
-21.57%
0%
-21.57%
1 Year
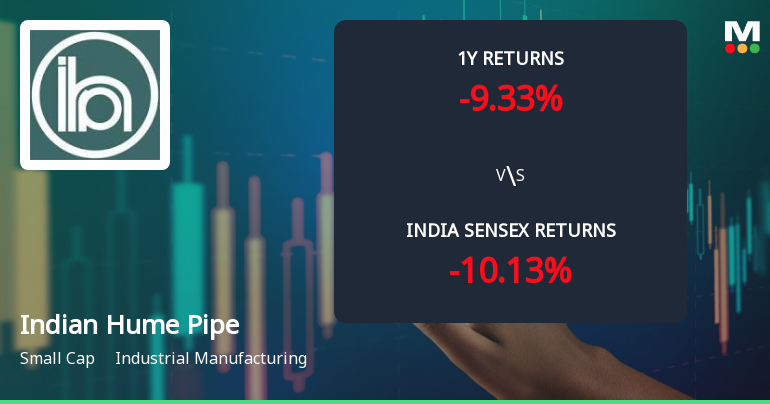
-27.85%
0.95%
-26.9%
2 Years
-3.97%
1.62%
-2.35%
3 Years
123.4%
3.29%
126.69%
4 Years
97.96%
6.24%
104.2%
5 Years
44.58%
4.87%
49.45%

Latest dividend: 4 per share ex-dividend date: Jul-18-2025

Risk Adjusted Returns v/s stock-summary
Returns Beta
Icon
Beta has not been calculated since enough price history is not available
stock-summaryNews & Corporate Actions

Announcements stock-summary

Indian Hume Pipe Company Limited - Other General Purpose

21-Nov-2019 | Source : NSE

Indian Hume Pipe Company Limited has submitted to the Exchange Disclosure of Related Party Transactions pursuant to Regulation 23(9) of Securities and Exchange Board of India (Listing Obligations and Disclosure Requirements) Regulations. 2015 (Listing Regulations).

Indian Hume Pipe Company Limited - Press Release

14-Nov-2019 | Source : NSE

Indian Hume Pipe Company Limited has informed the Exchange regarding a press release dated November 13, 2019, titled "Pursuant to Regulation 30 of SEBI (LODR) Regulations, 2015 we are enclosing herewith Press Release on the Unaudited Quarterly Financial Results for the 2nd quarter and 1st half-year ended 30th September, 2019.".

Indian Hume Pipe Company Limited - Press Release

04-Nov-2019 | Source : NSE

Indian Hume Pipe Company Limited has informed the Exchange regarding a press release dated November 02, 2019, titled "Newspaper publication of Board Meeting Intimation for Un-audited Financial Results for the 2nd quarter and 1st half-year ended 30th September, 2019".

Corporate Actions stock-summary

stock-summary
BOARD MEETING

No Upcoming Board Meetings

stock-summary
DIVIDEND

Indian Hume Pipe Company Ltd has declared 90% dividend, ex-date: 18 Jul 25

stock-summary
SPLITS

Indian Hume Pipe Company Ltd has announced 2:10 stock split, ex-date: 30 Aug 10

stock-summary
BONUS

Indian Hume Pipe Company Ltd has announced 1:1 bonus issue, ex-date: 09 Dec 16

stock-summary
RIGHTS

No Rights history available

stock-summaryKey Factors

Quality key factors stock-summary

Factor
Value
Sales Growth (5y)
1.01%
EBIT Growth (5y)
4.01%
EBIT to Interest (avg)
2.38
Debt to EBITDA (avg)
3.56
Net Debt to Equity (avg)
-0.12
Sales to Capital Employed (avg)
1.18
Tax Ratio
24.81%
Dividend Payout Ratio
5.48%
Pledged Shares
0
Institutional Holding
2.59%
ROCE (avg)
12.61%
ROE (avg)
7.98%

Valuation key factors

Factor
Value
P/E Ratio
18
Industry P/E
13
Price to Book Value
1.19
EV to EBIT
11.73
EV to EBITDA
10.14
EV to Capital Employed
1.22
EV to Sales
1.13
PEG Ratio
NA
Dividend Yield
1.86%
ROCE (Latest)
14.11%
ROE (Latest)
6.66%

Technicals key factors

Indicator
Weekly
Monthly
MACD
Mildly Bullish
Mildly Bearish
RSI
No Signal
No Signal
Bollinger Bands
Bearish
Bearish
Moving Averages
Bearish (Daily)
KST
Mildly Bullish
Mildly Bearish
Dow Theory
Mildly Bearish
Mildly Bearish
OBV
Mildly Bearish
Bullish
stock-summary Technical Indicator Scale: Bearish, Mildly Bearish, Sideways, Mildly Bullish, Bullish  Turned 
stock-summaryShareholding
Shareholding Snapshot : Mar 2026stock-summary
Shareholding Compare (%holding) stock-summary
Majority shareholders

Promoters

Pledged Promoter Holdings

None

Mutual Funds

Held by 2 Schemes (2.09%)

FIIs

Held by 23 FIIs (0.39%)

Promoter with highest holding

Ihp Finvest Limited (67.58%)

Highest Public shareholder

Ymsh Management Consultants Llp (1.64%)

Individual Investors Holdings

19.9%

stock-summaryFinancial
[
  {
    "link": "quarterly",
    "btn_text": "All Quarterly Results",
    "header": "Quarterly Results Snapshot (Standalone) - Mar'26 - YoY",
    "rhs": [
      {
        "prefix": "Net Sales ",
        "suffix": "YoY Growth in quarter ended Mar 2026 is -10.41% vs -3.02% in Mar 2025",
        "dir": -1
      },
      {
        "prefix": "Standalone Net Profit ",
        "suffix": "YoY Growth in quarter ended Mar 2026 is -95.40% vs 1,043.28% in Mar 2025",
        "dir": -1
      }
    ],
    "table": {
      "header": [
        "Mar'26",
        "Mar'25",
        "Change(%)"
      ],
      "body": [
        {
          "field": "Net Sales",
          "val1": "351.30",
          "val2": "392.10",
          "chgp": "-10.41%",
          "chgp_class": "negative"
        },
        {
          "field": "Operating Profit (PBDIT) excl Other Income",
          "val1": "38.32",
          "val2": "55.98",
          "chgp": "-31.55%",
          "chgp_class": "negative"
        },
        {
          "field": "Interest",
          "val1": "11.56",
          "val2": "16.16",
          "chgp": "-28.47%",
          "chgp_class": "positive"
        },
        {
          "field": "Exceptional Items",
          "val1": "0.00",
          "val2": "545.22",
          "chgp": "-100.00%",
          "chgp_class": "negative"
        },
        {
          "field": "Standalone Net Profit",
          "val1": "22.98",
          "val2": "499.27",
          "chgp": "-95.40%",
          "chgp_class": "negative"
        },
        {
          "field": "Operating Profit Margin (Excl OI)",
          "val1": "10.91%",
          "val2": "14.28%",
          "chgp": "-3.37%",
          "chgp_class": "negative"
        }
      ]
    }
  },
  {
    "link": "half-yearly",
    "btn_text": "All Half Yearly Results",
    "header": "Half Yearly Results Snapshot (Standalone) - Sep'25",
    "rhs": [
      {
        "prefix": "Net Sales ",
        "suffix": " Growth in half year ended Sep 2025 is -6.44% vs 7.92% in Sep 2024",
        "dir": -1
      },
      {
        "prefix": "Standalone Net Profit ",
        "suffix": " Growth in half year ended Sep 2025 is 27.44% vs 136.03% in Sep 2024",
        "dir": -1
      }
    ],
    "table": {
      "header": [
        "Sep'25",
        "Sep'24",
        "Change(%)"
      ],
      "body": [
        {
          "field": "Net Sales",
          "val1": "672.21",
          "val2": "718.51",
          "chgp": "-6.44%",
          "chgp_class": "negative"
        },
        {
          "field": "Operating Profit (PBDIT) excl Other Income",
          "val1": "85.28",
          "val2": "92.90",
          "chgp": "-8.20%",
          "chgp_class": "negative"
        },
        {
          "field": "Interest",
          "val1": "24.10",
          "val2": "30.22",
          "chgp": "-20.25%",
          "chgp_class": "positive"
        },
        {
          "field": "Exceptional Items",
          "val1": "0.00",
          "val2": "0.00",
          "chgp": "",
          "chgp_class": "neutral"
        },
        {
          "field": "Standalone Net Profit",
          "val1": "56.61",
          "val2": "44.42",
          "chgp": "27.44%",
          "chgp_class": "positive"
        },
        {
          "field": "Operating Profit Margin (Excl OI)",
          "val1": "12.69%",
          "val2": "12.93%",
          "chgp": "-0.24%",
          "chgp_class": "negative"
        }
      ]
    }
  },
  {
    "link": "nine-monthly",
    "btn_text": "All Nine Monthly Results",
    "header": "Nine Monthly Results Snapshot (Standalone) - Dec'25",
    "rhs": [
      {
        "prefix": "Net Sales ",
        "suffix": "YoY Growth in nine months ended Dec 2025 is -13.18% vs 11.66% in Dec 2024",
        "dir": -1
      },
      {
        "prefix": "Standalone Net Profit ",
        "suffix": "YoY Growth in nine months ended Dec 2025 is 100.92% vs 73.12% in Dec 2024",
        "dir": 1
      }
    ],
    "table": {
      "header": [
        "Dec'25",
        "Dec'24",
        "Change(%)"
      ],
      "body": [
        {
          "field": "Net Sales",
          "val1": "954.27",
          "val2": "1,099.13",
          "chgp": "-13.18%",
          "chgp_class": "negative"
        },
        {
          "field": "Operating Profit (PBDIT) excl Other Income",
          "val1": "107.41",
          "val2": "130.19",
          "chgp": "-17.50%",
          "chgp_class": "negative"
        },
        {
          "field": "Interest",
          "val1": "35.86",
          "val2": "46.19",
          "chgp": "-22.36%",
          "chgp_class": "positive"
        },
        {
          "field": "Exceptional Items",
          "val1": "64.33",
          "val2": "0.00",
          "chgp": "",
          "chgp_class": "neutral"
        },
        {
          "field": "Standalone Net Profit",
          "val1": "118.12",
          "val2": "58.79",
          "chgp": "100.92%",
          "chgp_class": "positive"
        },
        {
          "field": "Operating Profit Margin (Excl OI)",
          "val1": "11.26%",
          "val2": "11.84%",
          "chgp": "-0.58%",
          "chgp_class": "negative"
        }
      ]
    }
  },
  {
    "link": "annual",
    "btn_text": "All Annual Results",
    "header": "Annual Results Snapshot (Standalone) - Mar'26",
    "rhs": [
      {
        "prefix": "Net Sales ",
        "suffix": "YoY Growth in year ended Mar 2026 is -12.45% vs 7.39% in Mar 2025",
        "dir": -1
      },
      {
        "prefix": "Standalone Net Profit ",
        "suffix": "YoY Growth in year ended Mar 2026 is -74.71% vs 618.86% in Mar 2025",
        "dir": -1
      }
    ],
    "table": {
      "header": [
        "Mar'26",
        "Mar'25",
        "Change(%)"
      ],
      "body": [
        {
          "field": "Net Sales",
          "val1": "1,305.57",
          "val2": "1,491.23",
          "chgp": "-12.45%",
          "chgp_class": "negative"
        },
        {
          "field": "Operating Profit (PBDIT) excl Other Income",
          "val1": "145.73",
          "val2": "186.17",
          "chgp": "-21.72%",
          "chgp_class": "negative"
        },
        {
          "field": "Interest",
          "val1": "47.42",
          "val2": "62.35",
          "chgp": "-23.95%",
          "chgp_class": "positive"
        },
        {
          "field": "Exceptional Items",
          "val1": "64.33",
          "val2": "545.22",
          "chgp": "-88.20%",
          "chgp_class": "negative"
        },
        {
          "field": "Standalone Net Profit",
          "val1": "141.11",
          "val2": "558.05",
          "chgp": "-74.71%",
          "chgp_class": "negative"
        },
        {
          "field": "Operating Profit Margin (Excl OI)",
          "val1": "11.16%",
          "val2": "12.48%",
          "chgp": "-1.32%",
          "chgp_class": "negative"
        }
      ]
    }
  }
]

Quarterly Results Snapshot (Standalone) - Mar'26 - YoYstock-summary

Mar'26
Mar'25
Change(%)
Net Sales
351.30
392.10
-10.41%
Operating Profit (PBDIT) excl Other Income
38.32
55.98
-31.55%
Interest
11.56
16.16
-28.47%
Exceptional Items
0.00
545.22
-100.00%
Standalone Net Profit
22.98
499.27
-95.40%
Operating Profit Margin (Excl OI)
10.91%
14.28%
-3.37%
Values in Rs Cr.
Direction Arrows
Net Sales

YoY Growth in quarter ended Mar 2026 is -10.41% vs -3.02% in Mar 2025

Direction Arrows
Standalone Net Profit

YoY Growth in quarter ended Mar 2026 is -95.40% vs 1,043.28% in Mar 2025

Half Yearly Results Snapshot (Standalone) - Sep'25stock-summary

Sep'25
Sep'24
Change(%)
Net Sales
672.21
718.51
-6.44%
Operating Profit (PBDIT) excl Other Income
85.28
92.90
-8.20%
Interest
24.10
30.22
-20.25%
Exceptional Items
0.00
0.00
Standalone Net Profit
56.61
44.42
27.44%
Operating Profit Margin (Excl OI)
12.69%
12.93%
-0.24%
Values in Rs Cr.
Direction Arrows
Net Sales

Growth in half year ended Sep 2025 is -6.44% vs 7.92% in Sep 2024

Direction Arrows
Standalone Net Profit

Growth in half year ended Sep 2025 is 27.44% vs 136.03% in Sep 2024

Nine Monthly Results Snapshot (Standalone) - Dec'25stock-summary

Dec'25
Dec'24
Change(%)
Net Sales
954.27
1,099.13
-13.18%
Operating Profit (PBDIT) excl Other Income
107.41
130.19
-17.50%
Interest
35.86
46.19
-22.36%
Exceptional Items
64.33
0.00
Standalone Net Profit
118.12
58.79
100.92%
Operating Profit Margin (Excl OI)
11.26%
11.84%
-0.58%
Values in Rs Cr.
Direction Arrows
Net Sales

YoY Growth in nine months ended Dec 2025 is -13.18% vs 11.66% in Dec 2024

Direction Arrows
Standalone Net Profit

YoY Growth in nine months ended Dec 2025 is 100.92% vs 73.12% in Dec 2024

Annual Results Snapshot (Standalone) - Mar'26stock-summary

Mar'26
Mar'25
Change(%)
Net Sales
1,305.57
1,491.23
-12.45%
Operating Profit (PBDIT) excl Other Income
145.73
186.17
-21.72%
Interest
47.42
62.35
-23.95%
Exceptional Items
64.33
545.22
-88.20%
Standalone Net Profit
141.11
558.05
-74.71%
Operating Profit Margin (Excl OI)
11.16%
12.48%
-1.32%
Values in Rs Cr.
Direction Arrows
Net Sales

YoY Growth in year ended Mar 2026 is -12.45% vs 7.39% in Mar 2025

Direction Arrows
Standalone Net Profit

YoY Growth in year ended Mar 2026 is -74.71% vs 618.86% in Mar 2025

stock-summaryCompany CV
About Indian Hume Pipe Company Ltd stock-summary
stock-summary
Indian Hume Pipe Company Ltd
Small Cap
Industrial Manufacturing
Indian Hume Pipe Company Ltd, incorporated in 1926 is part of Walchand Harichand group. The company manufactures Hume Pipes, Hume Steel Pipes, Pre-stressed Concrete Pipes, Bar Wrapped Steel Cylinder Pipes, Steel Penstock Pipes, RCC Poles, Septic Tanks, RCC Lampposts and Manhole covers.
Company Coordinates stock-summary
Company Details
Construction House Ballard Est, 5 Walchand Hirachand Rd 2 Flr Mumbai Maharashtra : 400001
stock-summary
Tel: 91-022-22618091/92/40748181
stock-summary
info@indianhumepipe.com
Registrar Details
Link Intime India Pvt Ltd, C-13 Pannalal Silk Compound, L B S Marg, Bhandup , Mumbai