
Compare Indian Renewable with Similar Stocks
Dashboard
Despite the size of the company, domestic mutual funds hold only 0.48% of the company
- Domestic mutual funds have capability to do in-depth on-the-ground research on companies- their small stake may signify either they are not comfortable at the price or the business
Below par performance in long term as well as near term
Total Returns (Price + Dividend) 
Latest dividend: 0.6 per share ex-dividend date: Apr-02-2026
Risk Adjusted Returns v/s
Returns Beta

News

Indian Renewable Energy Development Agency Ltd is Rated Sell
Indian Renewable Energy Development Agency Ltd is rated 'Sell' by MarketsMOJO, with this rating last updated on 29 June 2026. However, the analysis and financial metrics discussed here reflect the stock's current position as of 04 July 2026, providing investors with the latest insights into its performance and outlook.
Read full news article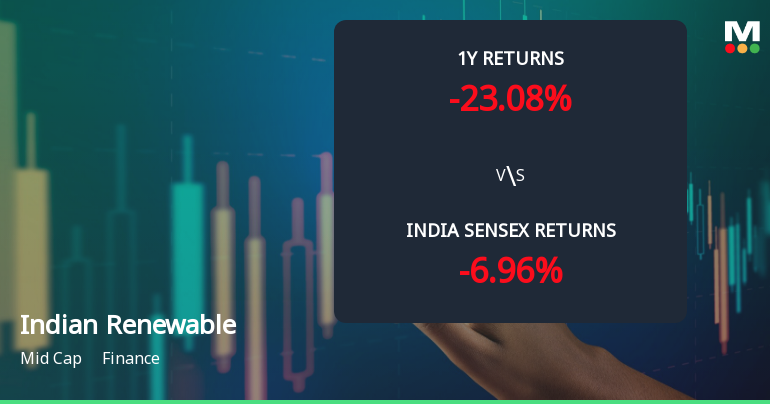
Indian Renewable Energy Development Agency Ltd Sees Technical Momentum Shift Amid Mixed Market Signals
Indian Renewable Energy Development Agency Ltd (IREDA) has experienced a notable shift in its technical momentum, transitioning from a sideways trend to a mildly bearish stance. Despite this, several weekly indicators suggest cautious optimism, while monthly signals remain mixed, reflecting a complex market environment for this mid-cap finance sector stock.
Read full news article
Indian Renewable Energy Development Agency Ltd is Rated Hold
Indian Renewable Energy Development Agency Ltd is rated 'Hold' by MarketsMOJO, with this rating last updated on 22 June 2026. However, the analysis and financial metrics discussed here reflect the stock's current position as of 23 June 2026, providing investors with the most up-to-date perspective on its performance and outlook.
Read full news article Announcements
Corporate Actions

No Upcoming Board Meetings

Indian Renewable Energy Development Agency Ltd has declared 6% dividend, ex-date: 02 Apr 26

No Splits history available

No Bonus history available

No Rights history available
Quality key factors
Valuation key factors
Technicals key factors
 Technical Indicator Scale: Bearish, Mildly Bearish, Sideways, Mildly Bullish, Bullish Turned
 Shareholding Snapshot : Mar 2026
Shareholding Compare (%holding)
Promoters
None
Held by 21 Schemes (0.14%)
Held by 89 FIIs (2.14%)
President Of India Through Secretary Mnre (71.76%)
Life Insurance Corporation Of India (2.21%)
22.25%
Quarterly Results Snapshot (Consolidated) - Mar'26 - QoQ

QoQ Growth in quarter ended Mar 2026 is 2.12% vs 3.54% in Dec 2025
QoQ Growth in quarter ended Mar 2026 is -15.81% vs 6.52% in Dec 2025
Half Yearly Results Snapshot (Standalone) - Sep'25
Growth in half year ended Sep 2025 is 27.52% vs 36.09% in Sep 2024
Growth in half year ended Sep 2025 is 3.14% vs 33.16% in Sep 2024
Nine Monthly Results Snapshot (Standalone) - Dec'25
YoY Growth in nine months ended Dec 2025 is 27.41% vs 35.67% in Dec 2024
YoY Growth in nine months ended Dec 2025 is 15.36% vs 30.82% in Dec 2024
Annual Results Snapshot (Consolidated) - Mar'26
YoY Growth in year ended Mar 2026 is 23.24% vs 35.85% in Mar 2025
YoY Growth in year ended Mar 2026 is 10.34% vs 35.62% in Mar 2025
About Indian Renewable Energy Development Agency Ltd

Company Coordinates


