
Compare Indian Sucrose with Similar Stocks
Dashboard
Poor long term growth as Net Sales has grown by an annual rate of 3.47% and Operating profit at 8.14% over the last 5 years
Positive results in Mar 26
With ROCE of 16.9, it has a Very Attractive valuation with a 0.6 Enterprise value to Capital Employed
Majority shareholders : Promoters
Below par performance in long term as well as near term
Total Returns (Price + Dividend) 
Indian Sucrose for the last several years.
Risk Adjusted Returns v/s
Returns Beta

News
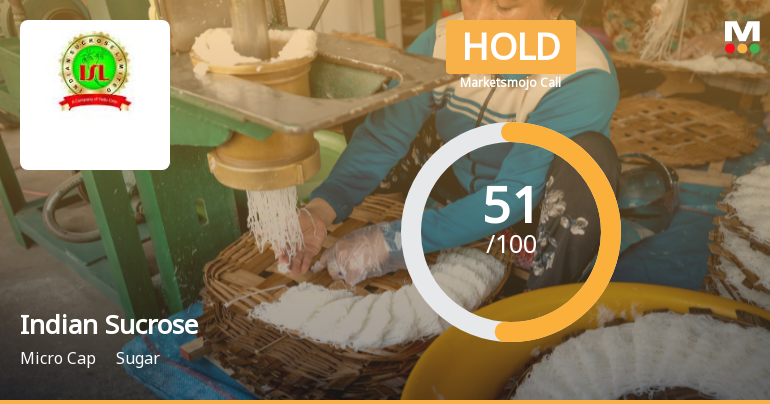
Indian Sucrose Ltd Upgraded to Hold as Technicals Improve Amid Mixed Financials
Indian Sucrose Ltd has seen its investment rating upgraded from Sell to Hold, reflecting a nuanced improvement across technical indicators, valuation metrics, and financial trends. Despite recent underperformance relative to the broader market, the company’s operational metrics and technical signals have prompted a reassessment of its outlook by analysts.
Read full news article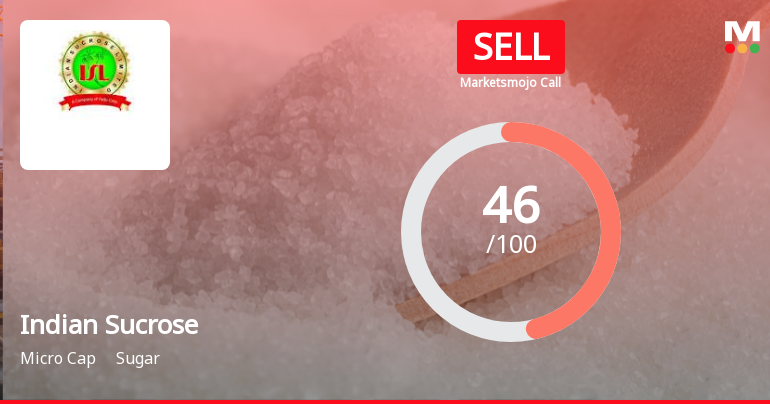
Indian Sucrose Ltd Downgraded to Sell Amid Weak Technicals and Growth Concerns
Indian Sucrose Ltd, a micro-cap player in the sugar sector, has seen its investment rating downgraded from Hold to Sell as of 12 June 2026. This shift reflects a combination of deteriorating technical indicators, modest financial trends, and valuation concerns despite some positive quarterly results. The company’s Mojo Score now stands at 46.0, signalling caution for investors amid a challenging market environment.
Read full news article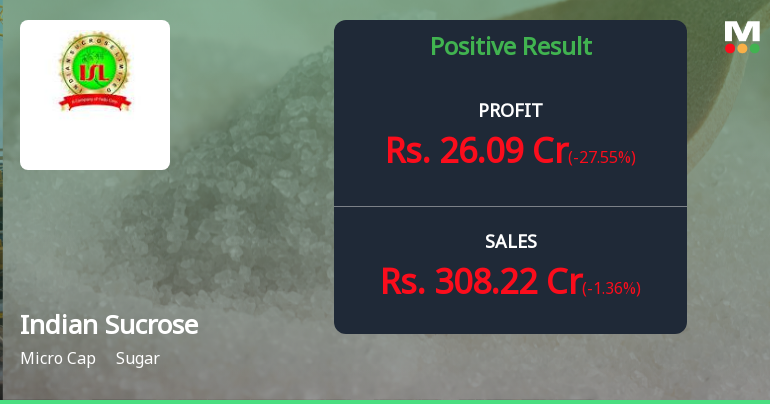
Indian Sucrose Q4 FY26: Strong Quarter Masks Underlying Volatility Concerns
Indian Sucrose Ltd., a Punjab-based sugar manufacturer with a market capitalisation of ₹136.00 crores, delivered a strong finish to FY26 with Q4 net profit surging to ₹26.09 crores, marking a 287.73% quarter-on-quarter increase from ₹6.73 crores in Q3 FY26. However, the year-on-year comparison reveals a concerning 27.55% decline from ₹36.01 crores in Q4 FY25, highlighting the company's persistent earnings volatility that has characterised its recent performance.
Read full news article Announcements
Closure of Trading Window
23-Jun-2026 | Source : BSEIntimation of Closure of Trading Window.
Intimation To The Shareholders Holding Shares In Physical Form To Furnish Valid PAN KYC Details Nomination And Bank Account Details.
23-Jun-2026 | Source : BSEAttachment as per captioned Subject.
Announcement under Regulation 30 (LODR)-Newspaper Publication
07-Jun-2026 | Source : BSESubmission of copies of Newspaper Advertisement of standalone Audited financial result for the Quarter and financial year ended 31st March 2026
Corporate Actions

No Upcoming Board Meetings

No Dividend history available

No Splits history available

No Bonus history available

No Rights history available
Quality key factors
Valuation key factors
Technicals key factors
 Technical Indicator Scale: Bearish, Mildly Bearish, Sideways, Mildly Bullish, Bullish Turned
 Shareholding Snapshot : Mar 2026
Shareholding Compare (%holding)
Promoters
8.7902
Held by 2 Schemes (0.03%)
Held by 0 FIIs
Yadu Sugar Limited (34.66%)
Mahendra Girdharilal (1.15%)
29.16%
Quarterly Results Snapshot (Standalone) - Mar'26 - YoY

YoY Growth in quarter ended Mar 2026 is -1.36% vs 19.78% in Mar 2025
YoY Growth in quarter ended Mar 2026 is -27.55% vs 12.22% in Mar 2025
Half Yearly Results Snapshot (Standalone) - Sep'25
Growth in half year ended Sep 2025 is -32.35% vs -10.11% in Sep 2024
Growth in half year ended Sep 2025 is -248.98% vs 55.86% in Sep 2024
Nine Monthly Results Snapshot (Standalone) - Dec'25
YoY Growth in nine months ended Dec 2025 is -13.15% vs -12.89% in Dec 2024
YoY Growth in nine months ended Dec 2025 is 111.81% vs 264.62% in Dec 2024
Annual Results Snapshot (Standalone) - Mar'26
YoY Growth in year ended Mar 2026 is -6.40% vs 3.23% in Mar 2025
YoY Growth in year ended Mar 2026 is -18.99% vs 17.23% in Mar 2025
About Indian Sucrose Ltd

Company Coordinates


