
Compare Indigo Paints with Similar Stocks
Dashboard
The company is Net-Debt Free
Poor long term growth as Net Sales has grown by an annual rate of 9.39% and Operating profit at 9.79% over the last 5 years
Positive results in Mar 26
With ROE of 13, it has a Attractive valuation with a 4.4 Price to Book Value
High Institutional Holdings at 30.41%
Consistent Underperformance against the benchmark over the last 3 years
Total Returns (Price + Dividend) 
Latest dividend: 3.5 per share ex-dividend date: Aug-22-2025
Risk Adjusted Returns v/s
Returns Beta

News

Indigo Paints Ltd Technical Momentum Shifts Amid Mixed Market Signals
Indigo Paints Ltd has experienced a notable shift in its technical momentum, moving from a sideways trend to a mildly bullish stance. Despite a recent day decline of 1.67%, the stock’s technical indicators present a complex picture, with weekly signals largely positive while monthly metrics remain cautious. This nuanced technical landscape, combined with the company’s recent downgrade from a Buy to Hold rating by MarketsMOJO, invites a closer examination of its price momentum and market positioning.
Read full news article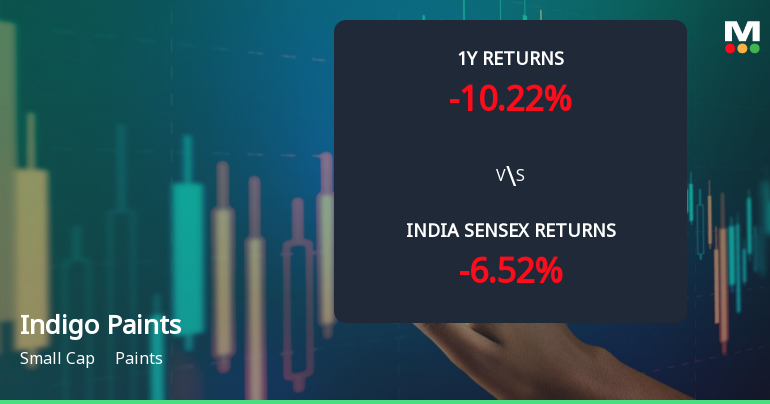
Indigo Paints Ltd Technical Momentum Shifts Amid Mixed Market Signals
Indigo Paints Ltd has experienced a notable shift in its technical momentum, moving from a mildly bearish trend to a sideways stance as of mid-July 2026. Despite a strong intraday gain of 4.49% to close at ₹1,084.05, the stock’s technical indicators present a complex picture, with bullish signals on some timeframes counterbalanced by bearish cues on others. This nuanced technical landscape warrants close attention from investors navigating the small-cap paints sector.
Read full news article
Indigo Paints Ltd Technical Momentum Shifts Amid Mixed Indicator Signals
Indigo Paints Ltd has experienced a notable shift in its technical momentum, moving from a sideways trend to a mildly bearish stance. Despite some bullish weekly indicators, monthly signals suggest caution, reflecting a complex interplay of market forces for this small-cap player in the paints sector.
Read full news article Announcements
Corporate Actions

13 Aug 2026

Indigo Paints Ltd has declared 35% dividend, ex-date: 22 Aug 25

No Splits history available

No Bonus history available

No Rights history available
Quality key factors
Valuation key factors
Technicals key factors
 Technical Indicator Scale: Bearish, Mildly Bearish, Sideways, Mildly Bullish, Bullish Turned
 Shareholding Snapshot : Mar 2026
Shareholding Compare (%holding)
Promoters
None
Held by 12 Schemes (22.69%)
Held by 90 FIIs (7.41%)
Hemant Kamala Jalan (17.97%)
Nippon Life India Trustee Ltd-a/c Nippon India Small Cap Fund (8.65%)
13.76%
Quarterly Results Snapshot (Consolidated) - Mar'26 - QoQ

QoQ Growth in quarter ended Mar 2026 is 18.55% vs 14.97% in Dec 2025
QoQ Growth in quarter ended Mar 2026 is 58.52% vs 44.88% in Dec 2025
Half Yearly Results Snapshot (Consolidated) - Sep'25

Growth in half year ended Sep 2025 is 1.71% vs 7.59% in Sep 2024
Growth in half year ended Sep 2025 is 4.48% vs -13.37% in Sep 2024
Nine Monthly Results Snapshot (Consolidated) - Dec'25
YoY Growth in nine months ended Dec 2025 is 2.79% vs 3.46% in Dec 2024
YoY Growth in nine months ended Dec 2025 is 3.00% vs -9.38% in Dec 2024
Annual Results Snapshot (Consolidated) - Mar'26
YoY Growth in year ended Mar 2026 is 4.80% vs 2.65% in Mar 2025
YoY Growth in year ended Mar 2026 is 2.34% vs -3.77% in Mar 2025
About Indigo Paints Ltd

Company Coordinates


