
Compare Indiqube Spaces with Similar Stocks
Dashboard
With HIgh Debt (Debt-Equity Ratio at 9.37 times)- the company has a Weak Long Term Fundamental Strength
- Poor long term growth as Net Sales has grown by an annual rate of 27.50% and Operating profit at 0% over the last 5 years
- The company is Net-Debt Free
With ROCE of 4.4, it has a Expensive valuation with a 1.5 Enterprise value to Capital Employed
Stock DNA
Diversified Commercial Services
INR 3,328 Cr (Small Cap)
NA (Loss Making)
32
0.00%
9.37
-20.66%
6.39
Total Returns (Price + Dividend) 
Indiqube Spaces for the last several years.
Risk Adjusted Returns v/s
Returns Beta

News
Indiqube Spaces Ltd is Rated Strong Sell
Indiqube Spaces Ltd is rated Strong Sell by MarketsMOJO, with this rating last updated on 25 May 2026. However, the analysis and financial metrics discussed here reflect the stock’s current position as of 10 June 2026, providing investors with the most up-to-date view of the company’s fundamentals, valuation, financial trends, and technical outlook.
Read full news article
Indiqube Spaces Ltd is Rated Strong Sell
Indiqube Spaces Ltd is rated Strong Sell by MarketsMOJO, with this rating last updated on 25 May 2026. However, the analysis and financial metrics discussed here reflect the stock's current position as of 30 May 2026, providing investors with the latest insights into the company’s fundamentals, valuation, financial trends, and technical outlook.
Read full news article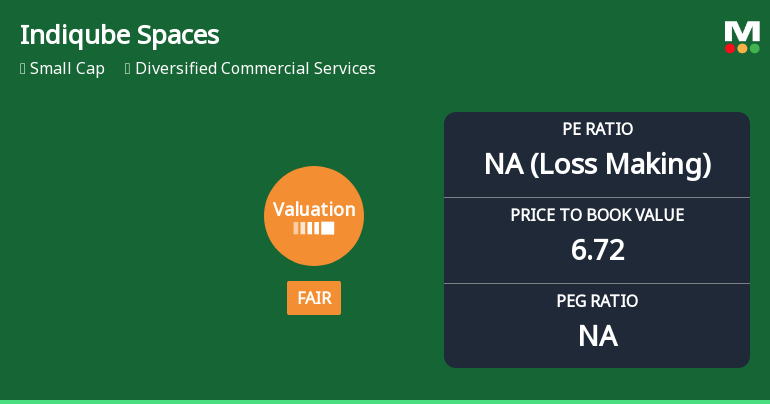
Indiqube Spaces Ltd Valuation Shifts Signal Changing Market Sentiment
Indiqube Spaces Ltd, a small-cap player in the diversified commercial services sector, has seen a notable shift in its valuation parameters, moving from an expensive to a fair valuation grade. Despite this adjustment, the stock continues to face downward pressure amid weak returns and deteriorating fundamentals, prompting a downgrade to a Strong Sell rating by MarketsMOJO as of 25 May 2026.
Read full news article Announcements
Announcement under Regulation 30 (LODR)-Analyst / Investor Meet - Intimation
01-Jun-2026 | Source : BSEIntimation of Analyst/ Investor Meet
Announcement under Regulation 30 (LODR)-Press Release / Media Release
01-Jun-2026 | Source : BSEPress Release
Announcement under Regulation 30 (LODR)-Earnings Call Transcript
27-May-2026 | Source : BSESubmission of transcript of Earnings calls held on May 21 2026 on the financial results for the quarter and year ended March 31 2026
Corporate Actions

No Upcoming Board Meetings

No Dividend history available

No Splits history available

No Bonus history available

No Rights history available
Quality key factors
Valuation key factors
Technicals key factors
 Technical Indicator Scale: Bearish, Mildly Bearish, Sideways, Mildly Bullish, Bullish Turned
 Shareholding Snapshot : Mar 2026
Shareholding Compare (%holding)
Promoters
None
Held by 8 Schemes (9.21%)
Held by 13 FIIs (2.18%)
Anshuman Das (21.81%)
Aravali Investment Holdings (19.14%)
2.77%
Quarterly Results Snapshot (Standalone) - Mar'26 - QoQ

QoQ Growth in quarter ended Mar 2026 is 2.95% vs 11.37% in Dec 2025
QoQ Growth in quarter ended Mar 2026 is -32.69% vs 42.85% in Dec 2025
Half Yearly Results Snapshot (Standalone) - Sep'25
Not Applicable: The company has declared_date for only one period
Not Applicable: The company has declared_date for only one period
Nine Monthly Results Snapshot (Standalone) - Dec'25
Not Applicable: The company has declared_date for only one period
Not Applicable: The company has declared_date for only one period
Annual Results Snapshot (Standalone) - Mar'26

YoY Growth in year ended Mar 2026 is 36.96% vs 27.54% in Mar 2025
YoY Growth in year ended Mar 2026 is 23.84% vs 59.12% in Mar 2025
About Indiqube Spaces Ltd

Company Coordinates


