
Compare Indo Amines with Similar Stocks
Dashboard
Low ability to service debt as the company has a high Debt to EBITDA ratio of 2.53 times
- Low ability to service debt as the company has a high Debt to EBITDA ratio of 2.53 times
Poor long term growth as Operating profit has grown by an annual rate 15.10% of over the last 5 years
Positive results in Mar 26
With ROCE of 14.9, it has a Attractive valuation with a 1.9 Enterprise value to Capital Employed
Despite the size of the company, domestic mutual funds hold only 0% of the company
Stock DNA
Specialty Chemicals
INR 997 Cr (Micro Cap)
13.00
43
0.36%
0.73
20.22%
2.57
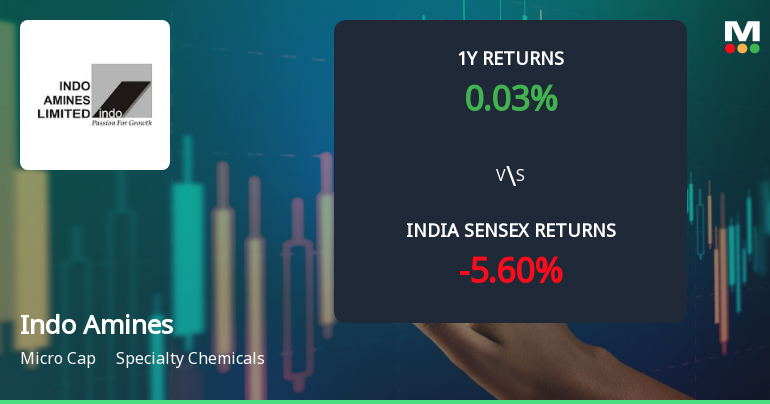
Total Returns (Price + Dividend) 
Latest dividend: 0.5 per share ex-dividend date: Sep-17-2025
Risk Adjusted Returns v/s
Returns Beta

News
Indo Amines Ltd Sees Technical Momentum Shift Amid Strong Price Gains
Indo Amines Ltd has experienced a notable shift in its technical momentum, moving from a mildly bearish stance to a mildly bullish outlook. This change is underpinned by a combination of bullish signals across key technical indicators including MACD, Bollinger Bands, and moving averages, signalling renewed investor interest in the specialty chemicals company.
Read full news article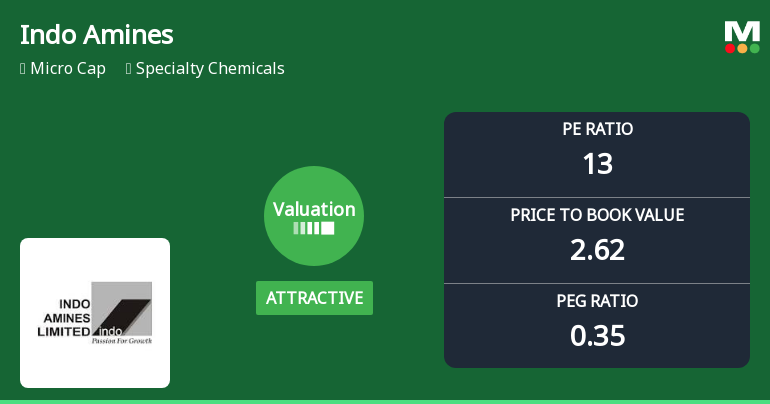
Indo Amines Ltd Valuation Improves Amid Strong Price Performance
Indo Amines Ltd has witnessed a notable shift in its valuation parameters, moving from a very attractive to an attractive rating, reflecting improved price appeal for investors. With a current price of ₹143.40 and a market cap classified as micro-cap, the specialty chemicals company’s price-to-earnings (P/E) and price-to-book value (P/BV) ratios now present a compelling case when compared to both historical levels and peer averages.
Read full news article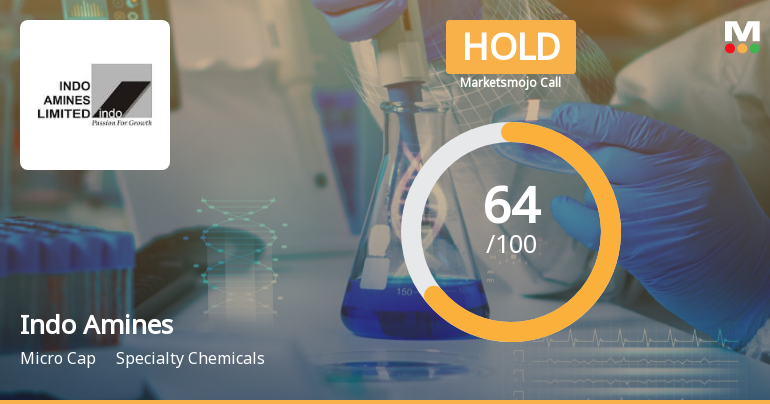
Indo Amines Ltd is Rated Hold by MarketsMOJO
Indo Amines Ltd is rated 'Hold' by MarketsMOJO, with this rating last updated on 26 May 2026. While the rating was revised on that date, the analysis and financial metrics discussed here reflect the company’s current position as of 20 June 2026, providing investors with an up-to-date view of the stock’s fundamentals, valuation, financial trends, and technical outlook.
Read full news article Announcements
Announcement under Regulation 30 (LODR)-Newspaper Publication
16-Jun-2026 | Source : BSEPlease find attached herewith Newspaper publication intimation.
Shareholder Meeting / Postal Ballot-Notice of Postal Ballot
15-Jun-2026 | Source : BSEPlease attached herewith notice of postal ballot dated 26th May 2026.
Compliances-Reg.24(A)-Annual Secretarial Compliance
29-May-2026 | Source : BSEPlease find attached herewith intimation regarding submission of Annual Secretarial Compliance Report for the year ended March 2026.
Corporate Actions

No Upcoming Board Meetings

Indo Amines Ltd has declared 10% dividend, ex-date: 17 Sep 25

Indo Amines Ltd has announced 5:10 stock split, ex-date: 13 Jan 22

Indo Amines Ltd has announced 1:1 bonus issue, ex-date: 16 Sep 13

No Rights history available
Quality key factors
Valuation key factors
Technicals key factors
 Technical Indicator Scale: Bearish, Mildly Bearish, Sideways, Mildly Bullish, Bullish Turned
 Shareholding Snapshot : Mar 2026
Shareholding Compare (%holding)
Promoters
None
Held by 0 Schemes
Held by 1 FIIs (0.02%)
Techno Securities India Pvt Ltd (11.52%)
Unigroup Resources Llp (8.43%)
26.45%
Quarterly Results Snapshot (Consolidated) - Mar'26 - QoQ

QoQ Growth in quarter ended Mar 2026 is 14.49% vs 0.13% in Dec 2025
QoQ Growth in quarter ended Mar 2026 is 72.79% vs -34.46% in Dec 2025
Half Yearly Results Snapshot (Consolidated) - Sep'25

Growth in half year ended Sep 2025 is 5.70% vs 7.58% in Sep 2024
Growth in half year ended Sep 2025 is 41.84% vs 37.46% in Sep 2024
Nine Monthly Results Snapshot (Consolidated) - Dec'25
YoY Growth in nine months ended Dec 2025 is 6.18% vs 14.85% in Dec 2024
YoY Growth in nine months ended Dec 2025 is 32.45% vs 31.00% in Dec 2024
Annual Results Snapshot (Consolidated) - Mar'26
YoY Growth in year ended Mar 2026 is 7.51% vs 14.33% in Mar 2025
YoY Growth in year ended Mar 2026 is 41.91% vs 30.09% in Mar 2025
About Indo Amines Ltd

Company Coordinates


