
Compare Indo Amines with Similar Stocks
Dashboard
Low ability to service debt as the company has a high Debt to EBITDA ratio of 2.53 times
- Low ability to service debt as the company has a high Debt to EBITDA ratio of 2.53 times
Poor long term growth as Operating profit has grown by an annual rate 15.10% of over the last 5 years
Positive results in Mar 26
With ROCE of 14.9, it has a Very Attractive valuation with a 1.8 Enterprise value to Capital Employed
Despite the size of the company, domestic mutual funds hold only 0% of the company
Stock DNA
Specialty Chemicals
INR 978 Cr (Micro Cap)
12.00
42
0.37%
0.73
20.22%
2.48
Total Returns (Price + Dividend) 
Latest dividend: 0.5 per share ex-dividend date: Sep-17-2025
Risk Adjusted Returns v/s
Returns Beta

News
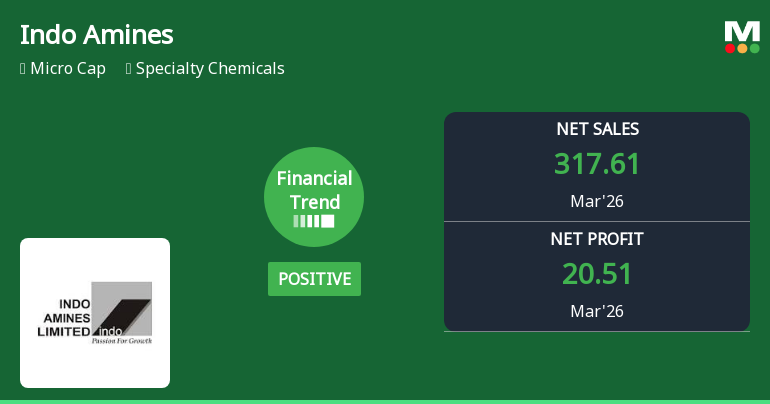
Indo Amines Ltd Reports Mixed Financial Trend Amid Margin Stability
Indo Amines Ltd, a micro-cap player in the specialty chemicals sector, has delivered a robust quarterly performance in March 2026, marked by record sales and profit metrics. However, despite these gains, the company’s overall financial trend has shifted from positive to flat, prompting a downgrade in its Mojo Grade from Hold to Sell as of 26 May 2026.
Read full news article
Indo Amines Ltd is Rated Hold by MarketsMOJO
Indo Amines Ltd is rated 'Hold' by MarketsMOJO, with this rating last updated on 26 May 2026. While the rating change occurred on that date, the analysis and financial metrics discussed here reflect the company’s current position as of 09 June 2026, providing investors with the most up-to-date view of the stock’s fundamentals, valuation, financial trends, and technical outlook.
Read full news article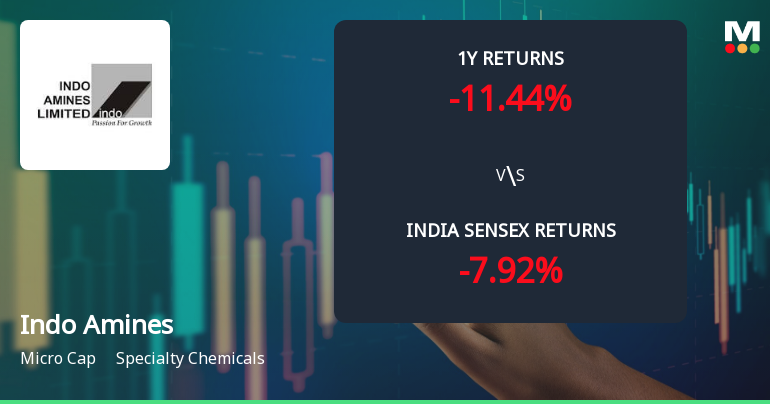
Indo Amines Ltd Technical Momentum Shifts Signal Mild Bullish Outlook
Indo Amines Ltd, a micro-cap player in the specialty chemicals sector, has witnessed a notable shift in its technical momentum, moving from a sideways trend to a mildly bullish stance. Recent technical indicators, including MACD, Bollinger Bands, and KST, suggest improving price dynamics, while moving averages and monthly signals present a more cautious backdrop. This nuanced technical picture, combined with the company’s recent Mojo Grade upgrade to Hold, offers investors a balanced view of potential near-term opportunities and risks.
Read full news article Announcements
Compliances-Reg.24(A)-Annual Secretarial Compliance
29-May-2026 | Source : BSEPlease find attached herewith intimation regarding submission of Annual Secretarial Compliance Report for the year ended March 2026.
Announcement under Regulation 30 (LODR)-Newspaper Publication
28-May-2026 | Source : BSEPlease find attached herewith intimation regarding Newspaper Publication copies of Audited Financial Results for the quarter and year ended 31st March 2026.
Corporate Action-Board approves Dividend
26-May-2026 | Source : BSEPlease find attached herewith outcome of the Board Meeting held on Tuesday 26th May 2026
Corporate Actions

No Upcoming Board Meetings

Indo Amines Ltd has declared 10% dividend, ex-date: 17 Sep 25

Indo Amines Ltd has announced 5:10 stock split, ex-date: 13 Jan 22

Indo Amines Ltd has announced 1:1 bonus issue, ex-date: 16 Sep 13

No Rights history available
Quality key factors
Valuation key factors
Technicals key factors
 Technical Indicator Scale: Bearish, Mildly Bearish, Sideways, Mildly Bullish, Bullish Turned
 Shareholding Snapshot : Mar 2026
Shareholding Compare (%holding)
Promoters
None
Held by 0 Schemes
Held by 1 FIIs (0.02%)
Techno Securities India Pvt Ltd (11.52%)
Unigroup Resources Llp (8.43%)
26.45%
Quarterly Results Snapshot (Consolidated) - Mar'26 - QoQ

QoQ Growth in quarter ended Mar 2026 is 14.49% vs 0.13% in Dec 2025
QoQ Growth in quarter ended Mar 2026 is 72.79% vs -34.46% in Dec 2025
Half Yearly Results Snapshot (Consolidated) - Sep'25

Growth in half year ended Sep 2025 is 5.70% vs 7.58% in Sep 2024
Growth in half year ended Sep 2025 is 41.84% vs 37.46% in Sep 2024
Nine Monthly Results Snapshot (Consolidated) - Dec'25
YoY Growth in nine months ended Dec 2025 is 6.18% vs 14.85% in Dec 2024
YoY Growth in nine months ended Dec 2025 is 32.45% vs 31.00% in Dec 2024
Annual Results Snapshot (Consolidated) - Mar'26
YoY Growth in year ended Mar 2026 is 7.51% vs 14.33% in Mar 2025
YoY Growth in year ended Mar 2026 is 41.91% vs 30.09% in Mar 2025
About Indo Amines Ltd

Company Coordinates


