Indo Borax & Ch.

  • Market Cap: Micro Cap
  • Industry: Commodity Chemicals
  • ISIN: INE803D01021
  • NSEID: INDOBORAX
  • BSEID: 524342
INR
344.20
13.15 (3.97%)
BSENSE

May 29

BSE+NSE Vol: 2.99 lacs

  • Price Points
  • Score
  • Mojo Parameters
  • Total Return
  • News and Corporate Actions
  • Key factors
  • Shareholding
  • Financials
  • CompanyCV
stock-summaryPrice Point
High/Low

1Day

52 Week

Valuation
Technical
Day's Volume

CASH

2.99 lacs (-19.02%) Volume

Shareholding (Mar 2026)

FII

0.45%

Held by 5 FIIs

DII

2.19%

Held by 0 DIIs

Promoter

30.80%

Who are in the management team of Indo Borax & Ch.?

06-Jun-2025

As of March 2022, the management team of Indo Borax & Ch. includes Sajal Jain (Managing Director & CFO), Arun S Sureka, Narendra Kumar Mittal, Govind R Parmar (all Non-Executive & Independent Directors), Pravin Chavan (Company Secretary & Compliance Officer), Sreelekha Jain (Non-Executive & Non-Independent Director), and Sachin N. Gupta (Independent Director).

As of March 2022, the management team of Indo Borax & Ch. includes the following individuals:<BR><BR>1. Sajal Jain - Managing Director & CFO<BR>2. Arun S Sureka - Non-Executive & Independent Director<BR>3. Narendra Kumar Mittal - Non-Executive & Independent Director<BR>4. Govind R Parmar - Non-Executive & Independent Director<BR>5. Pravin Chavan - Company Secretary & Compliance Officer<BR>6. Sreelekha Jain - Non-Executive & Non-Independent Director<BR>7. Sachin N. Gupta - Independent Director<BR><BR>These members play various roles within the company, contributing to its governance and operational management.

View full answer

What does Indo Borax & Ch. do?

06-Jun-2025

Indo Borax and Chemicals Ltd manufactures and sells Boron and Lithium products in the Commodity Chemicals industry, with a market cap of Rs 633 Cr and reported net sales of 50 Cr and net profit of 10 Cr for March 2025. Key metrics include a P/E of 15.00, a dividend yield of 0.51%, and a return on equity of 12.67%.

Overview:<BR>Indo Borax and Chemicals Ltd is engaged in the manufacturing and selling of Boron and Lithium products, operating within the Commodity Chemicals industry and classified as a Micro Cap company.<BR><BR>History:<BR>The company was incorporated in an unspecified year, with its latest reported quarterly results for net sales and profit being for March 2025.<BR><BR>Financial Snapshot:<BR>- Net Sales: 50 Cr (Quarterly Results - Mar 2025)<BR>- Net Profit: 10 Cr (Quarterly Results - Mar 2025)<BR>- Market-cap value: Rs 633 Cr (Micro Cap)<BR><BR>Key Metrics:<BR>- P/E: 15.00<BR>- Industry P/E: 47<BR>- Dividend Yield: 0.51%<BR>- Debt-Equity: -0.25<BR>- Return on Equity: 12.67%<BR>- Price to Book: 1.87<BR><BR>Contact Details:<BR>Address: 302 Link Rose Linking Road, Santacruz (West) Mumbai Maharashtra : 400054<BR>Tel: 91-22-26489142<BR>Email: indoborax@vsnl.com<BR>Website: http://www.indoborax.com

View full answer

Has Indo Borax & Ch. declared dividend?

06-Jun-2025

Indo Borax & Chemicals Ltd has declared a 100% dividend, amounting to ₹1 per share, with an ex-date of August 20, 2024. The company has shown significant long-term growth, with a total return of 809.65% over the past five years.

Indo Borax & Chemicals Ltd has declared a 100% dividend.<BR><BR>Dividend Details:<BR>- Percentage announced: 100%<BR>- Amount per share: 1 per share<BR>- Ex-date: 20 Aug 24<BR><BR>Dividend Yield: 0.51%.<BR><BR>Total Returns by Period:<BR>In the last 6 months, the price return was -3.68%, with a dividend return of 0%, resulting in a total return of -3.68%.<BR><BR>Over the past year, the price return was 25.9%, the dividend return was 0.62%, leading to a total return of 26.52%.<BR><BR>In the 2-year period, the price return was 59.94%, with a dividend return of 1.52%, culminating in a total return of 61.46%.<BR><BR>For the 3-year period, the price return was 78.73%, and the dividend return was 2.89%, resulting in a total return of 81.62%.<BR><BR>In the last 4 years, the price return was 57.3%, with a dividend return of 2.89%, giving a total return of 60.19%.<BR><BR>Over the past 5 years, the price return was 793.23%, and the dividend return was 16.42%, leading to an impressive total return of 809.65%.<BR><BR>Overall, Indo Borax & Chemicals Ltd has declared a substantial dividend, and while recent returns have varied, the long-term performance shows significant growth, particularly over the last five years.

View full answer

Who are the peers of the Indo Borax & Ch.?

03-Jun-2025

Indo Borax & Ch.'s peers include Tata Chemicals, Chemplast Sanmar, GHCL, India Glycols, Fischer Medical, Vikram Thermo, Mangalam Organic, OCCL, and Andhra Petrochem. Most peers show Below Average growth, with India Glycols having the highest 1-year return at 150.85%, while Indo Borax & Ch. has a 1-year return of 34.41%.

Peers: The peers of Indo Borax & Ch. are Tata Chemicals, Chemplast Sanmar, GHCL, India Glycols, Fischer Medical, Vikram Thermo, Mangalam Organic, OCCL, and Andhra Petrochem.<BR><BR>Quality Snapshot: Excellent management risk is observed at GHCL, while Good management risk is found at Chemplast Sanmar and Fischer Medical. Average management risk is present at Tata Chemicals, India Glycols, Indo Borax & Ch., Vikram Thermo, Mangalam Organic, and Andhra Petrochem, and the rest. OCCL does not qualify for management risk assessment. All peers exhibit Below Average growth except for Vikram Thermo, which has Good growth, while the rest have Below Average growth. Capital Structure is Excellent for GHCL, Indo Borax & Ch., and Andhra Petrochem, Average for Tata Chemicals, Mangalam Organic, and Vikram Thermo, and Below Average for Chemplast Sanmar and India Glycols, with Fischer Medical showing Good capital structure. OCCL does not qualify for capital structure assessment.<BR><BR>Return Snapshot: India Glycols has the highest 1-year return at 150.85%, while Andhra Petrochem has the lowest at -44.41%. Indo Borax & Ch. has a 1-year return of 34.41%, which is significantly higher than Andhra Petrochem's but lower than India Glycols'. Additionally, Andhra Petrochem and Vikram Thermo have negative six-month returns.

View full answer

Is Indo Borax & Ch. overvalued or undervalued?

10-Jul-2025

As of July 9, 2025, Indo Borax & Ch. is considered very expensive and overvalued with a PE ratio of 17.29, an EV to EBITDA of 14.16, and a Price to Book Value of 2.19, despite outperforming the Sensex with a year-to-date return of 27.08%.

As of 9 July 2025, the valuation grade for Indo Borax & Ch. has moved from expensive to very expensive, indicating a significant increase in perceived valuation. The company is currently considered overvalued. Key ratios include a PE ratio of 17.29, an EV to EBITDA of 14.16, and a Price to Book Value of 2.19, which suggest that the stock is trading at a premium compared to its earnings and book value.<BR><BR>In comparison to peers, Indo Borax & Ch. has a PE ratio lower than Solar Industries, which stands at 123.39, but higher than Godrej Industries, which is at 39.26. The EV to EBITDA ratio for Indo Borax & Ch. is also lower than that of Solar Industries but significantly higher than Godrej Industries' 30.92. Despite the strong recent stock performance, with a year-to-date return of 27.08% compared to the Sensex's 6.91%, the overall valuation metrics indicate that Indo Borax & Ch. is overvalued in its current market position.

View full answer

Who are the top shareholders of the Indo Borax & Ch.?

17-Jul-2025

The top shareholders of Indo Borax & Chemicals include promoter Sajal Sushilkumar Jain with 26.35% ownership, individual investors holding 34.17%, and public shareholder Dipak Kanayalal Shah at 1.11%. There are no pledged promoter holdings or mutual fund investments in the company.

The top shareholders of Indo Borax & Chemicals include the promoters, who hold the majority of the shares. The promoter with the highest holding is Sajal Sushilkumar Jain, owning 26.35% of the company. Additionally, individual investors collectively hold 34.17% of the shares. In terms of public shareholders, Dipak Kanayalal Shah is the highest, with a holding of 1.11%. There are also two foreign institutional investors (FIIs) that hold a small percentage, specifically 0.02%. Notably, there are no pledged promoter holdings, and no mutual funds are currently invested in the company.

View full answer

How big is Indo Borax & Ch.?

24-Jul-2025

As of 24th July, Indo Borax & Chemicals Ltd has a market capitalization of 811.00 Cr, with recent net sales of 175.26 Cr and a net profit of 42.50 Cr. The balance sheet for March 2024 shows shareholder's funds of 293.41 Cr and total assets of 311.26 Cr.

As of 24th July, Indo Borax & Chemicals Ltd has a market capitalization of 811.00 Cr, which categorizes it as a Micro Cap company.<BR><BR>In the latest four quarters, the company reported Net Sales of 175.26 Cr and a Net Profit of 42.50 Cr.<BR><BR>The latest annual period for the balance sheet is March 2024, showing Shareholder's Funds of 293.41 Cr and Total Assets of 311.26 Cr.

View full answer

How has been the historical performance of Indo Borax & Ch.?

12-Nov-2025

Indo Borax & Ch. has experienced declining net sales from 225.08 Cr in Mar'23 to 175.26 Cr in Mar'25, but improved profitability with operating profit rising to 61.48 Cr and profit after tax increasing to 42.51 Cr in the same period, alongside enhanced cash flow. Total assets and liabilities also grew, indicating a stronger financial position despite lower sales.

Answer:<BR>The historical performance of Indo Borax & Ch. shows a fluctuating trend in net sales and profitability over the years. <BR><BR>Breakdown:<BR>Indo Borax & Ch. reported net sales of 175.26 Cr in Mar'25, a decline from 191.30 Cr in Mar'24 and 225.08 Cr in Mar'23, indicating a downward trend over the last three years. Total operating income followed a similar pattern, with a decrease to 175.26 Cr in Mar'25 from 191.30 Cr in Mar'24. The raw material cost was 81.83 Cr in Mar'25, down from 101.96 Cr in Mar'24, contributing to a total expenditure of 129.37 Cr in Mar'25, which also decreased from 148.56 Cr in Mar'24. Operating profit (PBDIT) increased to 61.48 Cr in Mar'25 from 54.51 Cr in Mar'24, despite the drop in sales, reflecting improved operational efficiency. Profit before tax was 58.66 Cr in Mar'25, up from 52.23 Cr in Mar'24, while profit after tax rose to 42.51 Cr from 38.98 Cr in the same period. The company's total assets increased to 311.26 Cr in Mar'24 from 275.31 Cr in Mar'23, with total liabilities also rising to 311.26 Cr in Mar'24. Cash flow from operating activities improved to 67.00 Cr in Mar'24 from 60.00 Cr in Mar'23, leading to a closing cash and cash equivalent of 119.00 Cr in Mar'24, up from 85.00 Cr in Mar'23. Overall, while sales have decreased, the company has managed to enhance its profitability and cash flow position.

View full answer

Is Indo Borax & Ch. technically bullish or bearish?

18-Nov-2025

As of 17 November 2025, the trend is mildly bullish, supported by monthly indicators, while weekly indicators show mixed signals and uncertainty.

As of 17 November 2025, the technical trend has changed from bullish to mildly bullish. The current stance is mildly bullish, supported by the monthly MACD and KST indicators which are bullish, while the weekly MACD and KST are mildly bearish. The daily moving averages indicate a bullish sentiment. Bollinger Bands show a mildly bullish trend on both weekly and monthly time frames. However, the weekly Dow Theory indicates no trend, suggesting some uncertainty. Overall, the strength of the bullish stance is tempered by mixed signals in the weekly indicators.

View full answer

When is the next results date for Indo Borax & Chemicals Ltd?

19-May-2026

The next results date for Indo Borax & Chemicals Ltd is 21 May 2026.

The next results date for Indo Borax & Chemicals Ltd is scheduled for 21 May 2026.

View full answer

Are Indo Borax & Chemicals Ltd latest results good or bad?

22-May-2026

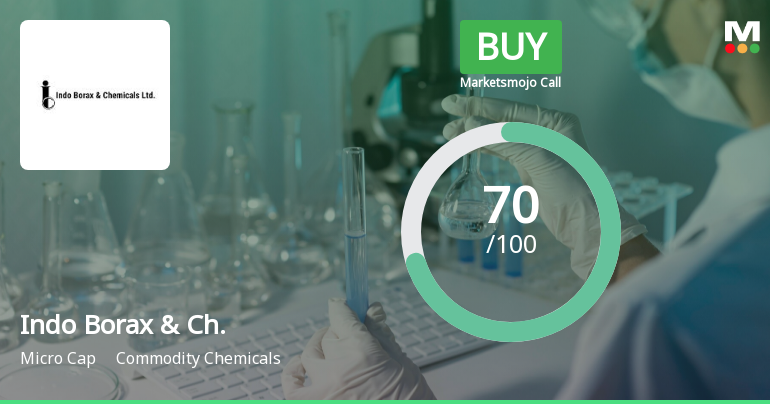
Indo Borax & Chemicals Ltd's latest results show strong revenue and net profit growth, but concerns about high valuation and modest long-term growth prospects lead to a "HOLD" rating for the stock.

Indo Borax & Chemicals Ltd's latest results for the quarter ending March 2026 present a mixed picture. On the positive side, the company reported a significant increase in both revenue and net profit. Revenue surged to ₹63.01 crores, marking a 53.61% increase quarter-on-quarter and a 25.72% increase year-on-year. Similarly, net profit rose to ₹14.53 crores, reflecting a 56.74% increase from the previous quarter and a 41.89% increase year-on-year. The company also maintained a healthy profit after tax (PAT) margin of 23.06%.<BR><BR>However, despite these strong quarterly results, there are concerns regarding the company's valuation. The stock is currently trading at 27 times trailing twelve-month earnings, which analysts consider a premium and have prompted caution. Additionally, the company's long-term growth trajectory appears modest, with a five-year sales growth of just 10.37% and EBIT growth of 3.96% annually. <BR><BR>The recent reduction in promoter holding from 50.80% to 30.80% raises questions about confidence in the company's future prospects. Furthermore, the company has faced challenges with working capital management, as indicated by a negative cash flow from operations in the previous fiscal year.<BR><BR>In summary, while the latest results show strong operational performance, the valuation concerns and long-term growth prospects suggest a cautious approach. The overall assessment translates into a "HOLD" rating for the stock, reflecting a balance between operational strength and valuation headwinds.

View full answer

Should I buy, sell or hold Indo Borax & Chemicals Ltd?

22-May-2026

Why is Indo Borax & Chemicals Ltd falling/rising?

29-May-2026

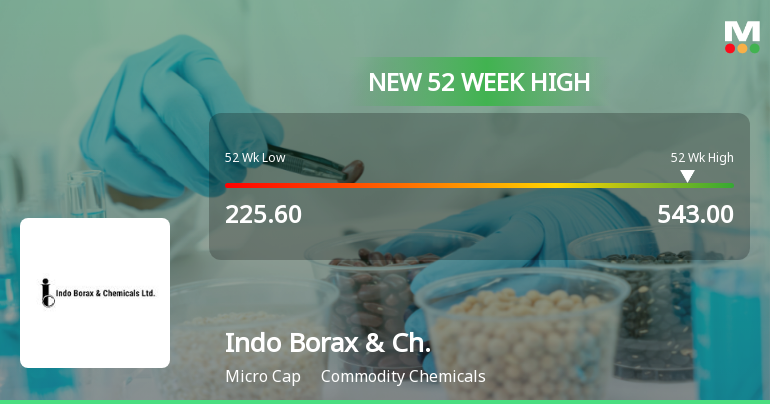
As of 29-May, Indo Borax & Chemicals Ltd's stock price has risen to 345.55, reflecting a 4.49% increase, supported by strong performance metrics and a new 52-week high. However, a significant drop in investor participation raises potential concerns for future trading activity.

As of 29-May, Indo Borax & Chemicals Ltd is experiencing a rise in its stock price, currently at 345.55, which reflects an increase of 14.85 or 4.49%. This upward movement is supported by several factors. The stock has outperformed the benchmark Sensex, showing a weekly gain of 7.18% compared to a decline of 0.85% in the Sensex. Over the past month, the stock has risen by 23.61%, while the Sensex has fallen by 3.51%. Year-to-date, Indo Borax has increased by 22.32%, contrasting with a 12.26% drop in the Sensex.<BR><BR>Additionally, the stock reached a new 52-week high of Rs. 352.6 today, indicating strong investor interest and confidence. It has also shown a trend reversal, gaining after two consecutive days of decline. The stock's performance today has outpaced its sector by 6.45%, further highlighting its strength in the market.<BR><BR>Moreover, Indo Borax is trading above its moving averages across various time frames, including the 5-day, 20-day, 50-day, 100-day, and 200-day averages, which is typically a bullish signal. However, it is worth noting that there has been a significant drop in investor participation, with delivery volume falling by 76.84% against the 5-day average, which could indicate a potential concern for future trading activity.<BR><BR>Overall, the combination of strong performance metrics, a new high, and positive trends contributes to the rising stock price of Indo Borax & Chemicals Ltd.

View full answer
iScoreScore
Click here to find our call on this stock
Strong Sell
Sell
Hold
Buy
Strong Buy

Dashboard

1

The company is Net-Debt Free

 
2

Poor long term growth as Operating profit has grown by an annual rate -0.92% of over the last 5 years

3

With ROE of 11.1, it has a Very Expensive valuation with a 2.9 Price to Book Value

4

100% of Promoter Shares are Pledged

5

Market Beating performance in long term as well as near term

stock-summaryMojo Parameters

Mojo Parameters

Loading Valuation Snapshot...

Stock DNA

stock-summary
Industry

Commodity Chemicals

stock-summary
Market cap

INR 1,061 Cr (Micro Cap)

stock-summary
P/E

26.00

stock-summary
Industry P/E

43

stock-summary
Dividend Yield

0.30%

stock-summary
Debt Equity

-0.54

stock-summary
Return on Equity

11.08%

stock-summary
Price to Book

2.74

Revenue and Profits:
Net Sales:
63 Cr
(Quarterly Results - Mar 2026)
Net Profit:
15 Cr
stock-summaryTotal Returns
Total Returns (Price + Dividend) stock-summary
Dividend Yield (0.3%)
TimePeriod
Price Return
Dividend Return
Total Return
3 Months
40.86%
0%
40.86%
6 Months
42.79%
0%
42.79%
1 Year
90.56%
0.50%
91.06%
2 Years
114.25%
1.22%
115.47%
3 Years
176.91%
2.28%
179.19%
4 Years
158.89%
4.13%
163.02%
5 Years
0%
0%
0.0%

Latest dividend: 1 per share ex-dividend date: Sep-18-2025

Risk Adjusted Returns v/s stock-summary
Returns Beta
Icon
Beta has not been calculated since enough price history is not available
stock-summaryKey Factors

Quality key factors stock-summary

Factor
Value
Sales Growth (5y)
8.37%
EBIT Growth (5y)
-0.92%
EBIT to Interest (avg)
46.36
Debt to EBITDA (avg)
Net Debt is too low
Net Debt to Equity (avg)
-0.54
Sales to Capital Employed (avg)
0.72
Tax Ratio
24.43%
Dividend Payout Ratio
8.23%
Pledged Shares
100.00%
Institutional Holding
2.64%
ROCE (avg)
28.83%
ROE (avg)
14.80%

Valuation key factors

Factor
Value
P/E Ratio
26
Industry P/E
43
Price to Book Value
2.87
EV to EBIT
21.91
EV to EBITDA
20.35
EV to Capital Employed
5.09
EV to Sales
4.17
PEG Ratio
25.88
Dividend Yield
0.29%
ROCE (Latest)
23.25%
ROE (Latest)
11.08%

Technicals key factors

Indicator
Weekly
Monthly
MACD
Bullish
Bullish
RSI
Bearish
No Signal
Bollinger Bands
Bullish
Bullish
Moving Averages
Bullish (Daily)
KST
Bullish
Bullish
Dow Theory
Bullish
Bullish
OBV
No Trend
Bullish
stock-summary Technical Indicator Scale: Bearish, Mildly Bearish, Sideways, Mildly Bullish, Bullish  Turned 
stock-summaryShareholding
Shareholding Snapshot : Mar 2026stock-summary
Shareholding Compare (%holding) stock-summary
Majority shareholders

Non Institution

Pledged Promoter Holdings

100

Mutual Funds

Held by 1 Schemes (0.37%)

FIIs

Held by 5 FIIs (0.45%)

Promoter with highest holding

Sajal Sushilkumar Jain (26.35%)

Highest Public shareholder

Dipak Kanayalal Shah (1.14%)

Individual Investors Holdings

30.78%

stock-summaryFinancial
[
  {
    "link": "quarterly",
    "btn_text": "All Quarterly Results",
    "header": "Quarterly Results Snapshot (Consolidated) - Mar'26 - QoQ",
    "rhs": [
      {
        "prefix": "Net Sales ",
        "suffix": "QoQ Growth in quarter ended Mar 2026 is 53.61% vs -29.09% in Dec 2025",
        "dir": 1
      },
      {
        "prefix": "Consolidated Net Profit ",
        "suffix": "QoQ Growth in quarter ended Mar 2026 is 56.74% vs -42.99% in Dec 2025",
        "dir": 1
      }
    ],
    "table": {
      "header": [
        "Mar'26",
        "Dec'25",
        "Change(%)"
      ],
      "body": [
        {
          "field": "Net Sales",
          "val1": "63.01",
          "val2": "41.02",
          "chgp": "53.61%",
          "chgp_class": "positive"
        },
        {
          "field": "Operating Profit (PBDIT) excl Other Income",
          "val1": "12.82",
          "val2": "8.63",
          "chgp": "48.55%",
          "chgp_class": "positive"
        },
        {
          "field": "Interest",
          "val1": "0.06",
          "val2": "0.00",
          "chgp": "",
          "chgp_class": "neutral"
        },
        {
          "field": "Exceptional Items",
          "val1": "0.80",
          "val2": "0.00",
          "chgp": "",
          "chgp_class": "neutral"
        },
        {
          "field": "Consolidate Net Profit",
          "val1": "14.53",
          "val2": "9.27",
          "chgp": "56.74%",
          "chgp_class": "positive"
        },
        {
          "field": "Operating Profit Margin (Excl OI)",
          "val1": "20.35%",
          "val2": "21.04%",
          "chgp": "-0.69%",
          "chgp_class": "negative"
        }
      ]
    }
  },
  {
    "link": "half-yearly",
    "btn_text": "All Half Yearly Results",
    "header": "Half Yearly Results Snapshot (Consolidated) - Sep'25",
    "rhs": [
      {
        "prefix": "Net Sales ",
        "suffix": " Growth in half year ended Sep 2025 is 27.13% vs -13.89% in Sep 2024",
        "dir": 1
      },
      {
        "prefix": "Consolidated Net Profit ",
        "suffix": " Growth in half year ended Sep 2025 is 14.14% vs 20.09% in Sep 2024",
        "dir": -1
      }
    ],
    "table": {
      "header": [
        "Sep'25",
        "Sep'24",
        "Change(%)"
      ],
      "body": [
        {
          "field": "Net Sales",
          "val1": "111.42",
          "val2": "87.64",
          "chgp": "27.13%",
          "chgp_class": "positive"
        },
        {
          "field": "Operating Profit (PBDIT) excl Other Income",
          "val1": "22.71",
          "val2": "25.61",
          "chgp": "-11.32%",
          "chgp_class": "negative"
        },
        {
          "field": "Interest",
          "val1": "0.00",
          "val2": "0.00",
          "chgp": "",
          "chgp_class": "neutral"
        },
        {
          "field": "Exceptional Items",
          "val1": "9.35",
          "val2": "0.00",
          "chgp": "",
          "chgp_class": "neutral"
        },
        {
          "field": "Consolidate Net Profit",
          "val1": "26.47",
          "val2": "23.19",
          "chgp": "14.14%",
          "chgp_class": "positive"
        },
        {
          "field": "Operating Profit Margin (Excl OI)",
          "val1": "20.38%",
          "val2": "29.22%",
          "chgp": "-8.84%",
          "chgp_class": "negative"
        }
      ]
    }
  },
  {
    "link": "nine-monthly",
    "btn_text": "All Nine Monthly Results",
    "header": "Nine Monthly Results Snapshot (Consolidated) - Dec'25",
    "rhs": [
      {
        "prefix": "Net Sales ",
        "suffix": "YoY Growth in nine months ended Dec 2025 is 21.81% vs -14.19% in Dec 2024",
        "dir": 1
      },
      {
        "prefix": "Consolidated Net Profit ",
        "suffix": "YoY Growth in nine months ended Dec 2025 is 10.79% vs 17.14% in Dec 2024",
        "dir": -1
      }
    ],
    "table": {
      "header": [
        "Dec'25",
        "Dec'24",
        "Change(%)"
      ],
      "body": [
        {
          "field": "Net Sales",
          "val1": "152.44",
          "val2": "125.15",
          "chgp": "21.81%",
          "chgp_class": "positive"
        },
        {
          "field": "Operating Profit (PBDIT) excl Other Income",
          "val1": "31.34",
          "val2": "35.69",
          "chgp": "-12.19%",
          "chgp_class": "negative"
        },
        {
          "field": "Interest",
          "val1": "0.00",
          "val2": "0.00",
          "chgp": "",
          "chgp_class": "neutral"
        },
        {
          "field": "Exceptional Items",
          "val1": "9.35",
          "val2": "0.00",
          "chgp": "",
          "chgp_class": "neutral"
        },
        {
          "field": "Consolidate Net Profit",
          "val1": "35.74",
          "val2": "32.26",
          "chgp": "10.79%",
          "chgp_class": "positive"
        },
        {
          "field": "Operating Profit Margin (Excl OI)",
          "val1": "20.56%",
          "val2": "28.52%",
          "chgp": "-7.96%",
          "chgp_class": "negative"
        }
      ]
    }
  },
  {
    "link": "annual",
    "btn_text": "All Annual Results",
    "header": "Annual Results Snapshot (Consolidated) - Mar'26",
    "rhs": [
      {
        "prefix": "Net Sales ",
        "suffix": "YoY Growth in year ended Mar 2026 is 22.93% vs -8.38% in Mar 2025",
        "dir": 1
      },
      {
        "prefix": "Consolidated Net Profit ",
        "suffix": "YoY Growth in year ended Mar 2026 is 18.25% vs 9.06% in Mar 2025",
        "dir": 1
      }
    ],
    "table": {
      "header": [
        "Mar'26",
        "Mar'25",
        "Change(%)"
      ],
      "body": [
        {
          "field": "Net Sales",
          "val1": "215.45",
          "val2": "175.26",
          "chgp": "22.93%",
          "chgp_class": "positive"
        },
        {
          "field": "Operating Profit (PBDIT) excl Other Income",
          "val1": "44.16",
          "val2": "45.89",
          "chgp": "-3.77%",
          "chgp_class": "negative"
        },
        {
          "field": "Interest",
          "val1": "0.07",
          "val2": "0.18",
          "chgp": "-61.11%",
          "chgp_class": "positive"
        },
        {
          "field": "Exceptional Items",
          "val1": "10.15",
          "val2": "0.00",
          "chgp": "",
          "chgp_class": "neutral"
        },
        {
          "field": "Consolidate Net Profit",
          "val1": "50.27",
          "val2": "42.51",
          "chgp": "18.25%",
          "chgp_class": "positive"
        },
        {
          "field": "Operating Profit Margin (Excl OI)",
          "val1": "20.50%",
          "val2": "26.18%",
          "chgp": "-5.68%",
          "chgp_class": "negative"
        }
      ]
    }
  }
]

Quarterly Results Snapshot (Consolidated) - Mar'26 - QoQstock-summary

Mar'26
Dec'25
Change(%)
Net Sales
63.01
41.02
53.61%
Operating Profit (PBDIT) excl Other Income
12.82
8.63
48.55%
Interest
0.06
0.00
Exceptional Items
0.80
0.00
Consolidate Net Profit
14.53
9.27
56.74%
Operating Profit Margin (Excl OI)
20.35%
21.04%
-0.69%
Values in Rs Cr.
Direction Arrows
Net Sales

QoQ Growth in quarter ended Mar 2026 is 53.61% vs -29.09% in Dec 2025

Direction Arrows
Consolidated Net Profit

QoQ Growth in quarter ended Mar 2026 is 56.74% vs -42.99% in Dec 2025

Half Yearly Results Snapshot (Consolidated) - Sep'25stock-summary

Sep'25
Sep'24
Change(%)
Net Sales
111.42
87.64
27.13%
Operating Profit (PBDIT) excl Other Income
22.71
25.61
-11.32%
Interest
0.00
0.00
Exceptional Items
9.35
0.00
Consolidate Net Profit
26.47
23.19
14.14%
Operating Profit Margin (Excl OI)
20.38%
29.22%
-8.84%
Values in Rs Cr.
Direction Arrows
Net Sales

Growth in half year ended Sep 2025 is 27.13% vs -13.89% in Sep 2024

Direction Arrows
Consolidated Net Profit

Growth in half year ended Sep 2025 is 14.14% vs 20.09% in Sep 2024

Nine Monthly Results Snapshot (Consolidated) - Dec'25stock-summary

Dec'25
Dec'24
Change(%)
Net Sales
152.44
125.15
21.81%
Operating Profit (PBDIT) excl Other Income
31.34
35.69
-12.19%
Interest
0.00
0.00
Exceptional Items
9.35
0.00
Consolidate Net Profit
35.74
32.26
10.79%
Operating Profit Margin (Excl OI)
20.56%
28.52%
-7.96%
Values in Rs Cr.
Direction Arrows
Net Sales

YoY Growth in nine months ended Dec 2025 is 21.81% vs -14.19% in Dec 2024

Direction Arrows
Consolidated Net Profit

YoY Growth in nine months ended Dec 2025 is 10.79% vs 17.14% in Dec 2024

Annual Results Snapshot (Consolidated) - Mar'26stock-summary

Mar'26
Mar'25
Change(%)
Net Sales
215.45
175.26
22.93%
Operating Profit (PBDIT) excl Other Income
44.16
45.89
-3.77%
Interest
0.07
0.18
-61.11%
Exceptional Items
10.15
0.00
Consolidate Net Profit
50.27
42.51
18.25%
Operating Profit Margin (Excl OI)
20.50%
26.18%
-5.68%
Values in Rs Cr.
Direction Arrows
Net Sales

YoY Growth in year ended Mar 2026 is 22.93% vs -8.38% in Mar 2025

Direction Arrows
Consolidated Net Profit

YoY Growth in year ended Mar 2026 is 18.25% vs 9.06% in Mar 2025

stock-summaryCompany CV
About Indo Borax & Chemicals Ltd stock-summary
stock-summary
Indo Borax & Chemicals Ltd
Micro Cap
Commodity Chemicals
Indo Borax and Chemicals Limited (IBCL) is into the business of manufacturing and selling of Boron and Lithium products which includes Boric Acid Technical Grade Powder & Granular, Boric Acid IP Grade (Indian Pharmacopoeia Grade) Powder & Granular, and Lithium Hydroxide Monohydrate. The Company's plant is located in Pithampur, Madhya Pradesh. Its BORIC ACID (Tech. Grade) Powder is used for fluxes and metallurgical operation, such as welding, paste fluxes and soldering fluxes.
Company Coordinates stock-summary
Company Details
302 Link Rose Linking Road, Santacruz (West) Mumbai Maharashtra : 400054
stock-summary
Tel: 91-22-26489142
stock-summary
indoborax@vsnl.com
Registrar Details
Sharex Dynamic (India) Pvt Ltd , Unit -1, Luthra Ind. Premises , Safed Pool, Andheri-Kurla Road, Andheri (E), Mumbai