
Compare Indo Cotspin with Similar Stocks
Dashboard
Weak Long Term Fundamental Strength with an average Return on Equity (ROE) of 2.75%
- Poor long term growth as Operating profit has grown by an annual rate 5.87% of over the last 5 years
- Company's ability to service its debt is weak with a poor EBIT to Interest (avg) ratio of 0.05
Flat results in Mar 26
With ROCE of 1.4, it has a Expensive valuation with a 2.8 Enterprise value to Capital Employed
Stock DNA
Garments & Apparels
INR 22 Cr (Micro Cap)
NA (Loss Making)
52
0.00%
0.16
-0.14%
3.05
Total Returns (Price + Dividend) 
Indo Cotspin for the last several years.
Risk Adjusted Returns v/s
Returns Beta

News
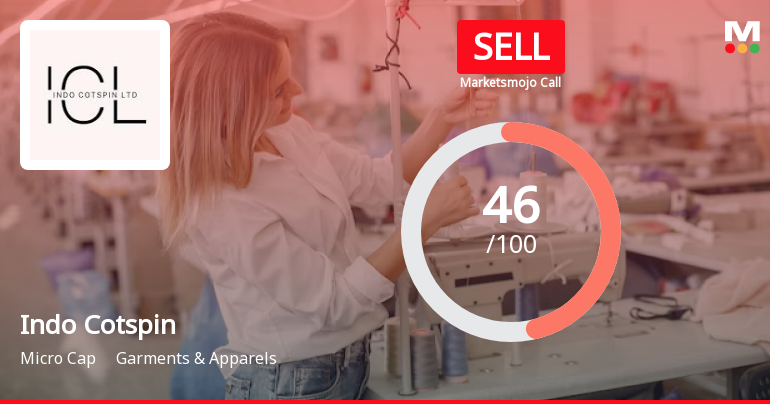
Indo Cotspin Ltd is Rated Sell by MarketsMOJO
Indo Cotspin Ltd is rated Sell by MarketsMOJO, with this rating last updated on 04 May 2026. While the rating change occurred on that date, the analysis and financial metrics discussed here reflect the stock's current position as of 21 May 2026, providing investors with the latest insights into the company’s performance and outlook.
Read full news articleAre Indo Cotspin Ltd latest results good or bad?
Indo Cotspin Ltd's latest financial results for Q4 FY26 reflect significant operational challenges. The company reported a net loss of ₹0.03 crores, marking a shift from a profit in the previous quarter, which indicates a concerning trend in profitability. Revenue for the quarter fell to ₹5.97 crores, a substantial decline of 41.12% compared to the previous quarter's revenue of ₹10.14 crores. This decline also represents a year-on-year decrease of 5.98% from ₹6.35 crores in Q4 FY25. Despite this revenue contraction, the operating margin showed a slight improvement, rising to 2.01% from 1.58% in the previous quarter. However, this margin remains low and insufficient to support sustainable profitability. The return on equity (ROE) for the latest quarter was recorded at a mere 0.14%, highlighting the company's struggle to generate adequate returns for its shareholders. The volatility in Indo Cotspin's revenu...
Read full news article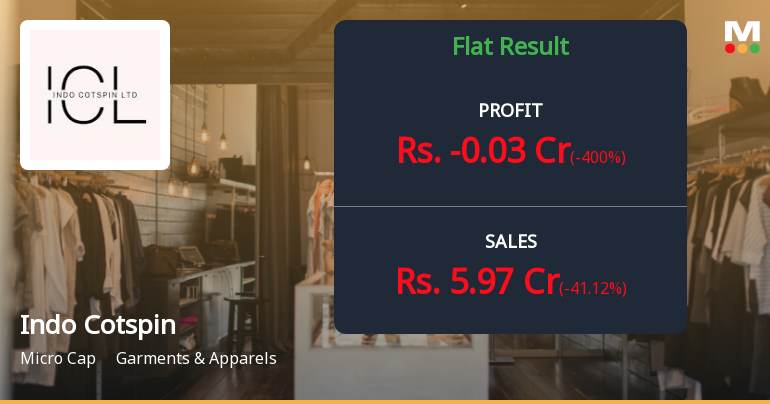
Indo Cotspin Q4 FY26: Losses Deepen as Margins Collapse Amid Revenue Volatility
Indo Cotspin Limited, a micro-cap player in the garments and apparels sector with a market capitalisation of ₹22.00 crores, reported a troubling fourth quarter for FY26, slipping into losses of ₹0.03 crores against a marginal profit of ₹0.01 crores in Q3 FY26. The company's stock plunged 9.58% to ₹28.32 following the results announcement, reflecting investor concerns over deteriorating operational metrics and persistent revenue volatility.
Read full news article Announcements
Announcement under Regulation 30 (LODR)-Newspaper Publication
13-May-2026 | Source : BSENewspaper advertisement titled statement of Standalone Audited Financial Results for the Quarter and year ended 31st March 2026
Standalone Audited Financial Results Of The Company For The Quarter And Year Ended 31St March 2026.
12-May-2026 | Source : BSEBoard of Directors at their meeting held today has inter alia considered and approved the Standalone Audited Financial Results of the Company for the Quarter and year ended 31st March 2026.
Board Meeting Outcome for Outcome Of The Board Meeting Pursuant To Regulation 30 Of SEBI (Listing Obligations & Disclosures Requirements) Regulations 2015
12-May-2026 | Source : BSEthe Board of Directors of Indo Cotspin Limited at their meeting held on Today i.e. Tuesday 12th May 2026 at the registered office of the Company has inter alia considered and approved the Standalone Audited Financial Results of the Company for the Quarter and year ended 31st March 2026.
Corporate Actions

No Upcoming Board Meetings

No Dividend history available

No Splits history available

Indo Cotspin Ltd has announced 7:10 bonus issue, ex-date: 10 Sep 24

No Rights history available
Quality key factors
Valuation key factors
Technicals key factors
 Technical Indicator Scale: Bearish, Mildly Bearish, Sideways, Mildly Bullish, Bullish Turned
 Shareholding Snapshot : Mar 2026
Shareholding Compare (%holding)
Promoters
None
Held by 0 Schemes
Held by 0 FIIs
Bal Kishan Aggarwal (11.79%)
2brothers Textiles Private Limited (13.71%)
25.88%
Quarterly Results Snapshot (Standalone) - Mar'26 - QoQ

QoQ Growth in quarter ended Mar 2026 is -41.12% vs 53.87% in Dec 2025
QoQ Growth in quarter ended Mar 2026 is -400.00% vs 0.00% in Dec 2025
Half Yearly Results Snapshot (Standalone) - Sep'25
Growth in half year ended Sep 2025 is 2.04% vs 57.77% in Sep 2024
Growth in half year ended Sep 2025 is -97.22% vs 500.00% in Sep 2024
Nine Monthly Results Snapshot (Standalone) - Dec'25
YoY Growth in nine months ended Dec 2025 is 0.27% vs 62.78% in Dec 2024
YoY Growth in nine months ended Dec 2025 is -95.12% vs 412.50% in Dec 2024
Annual Results Snapshot (Standalone) - Mar'26
YoY Growth in year ended Mar 2026 is -1.32% vs 50.06% in Mar 2025
YoY Growth in year ended Mar 2026 is -102.50% vs 471.43% in Mar 2025
About Indo Cotspin Ltd

Company Coordinates


